The activities are as follows:
- Teacher Guide
- Student activity, Graph Type A, Level 2
- Student activity, Graph Type B, Level 2
- Student activity, Graph Type C, Level 2
- Scientist Profile on Project Biodiversify
- Scientist Profile
- Grading Rubric
People use pharmaceutical drugs, personal care products, and other chemicals on a daily basis. For example, we take medicine when we are sick to feel better, and use perfumes and cologne to make ourselves smell good. After we use these chemicals, where do they go? Often, they get washed down our drains and end up in local waterways. Even our trash can contain these harmful chemicals. For example, when coffee grounds are thrown into the trash, caffeine gets washed into our waterways.
Animals in waterways, like insects, live with these chemicals every day. Many insects are born and grow in the water, absorbing the drugs over their lifetime. As predators eat the insects, the chemicals are passed on, working their way through the food web. For example, spiders living along riverbanks feed off aquatic insects and absorb the drugs from their prey.
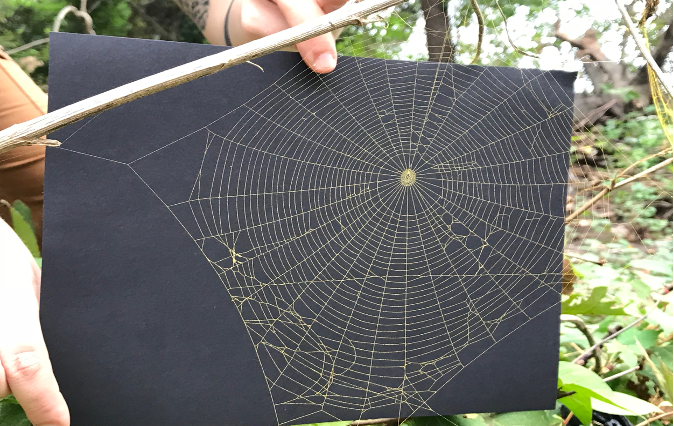
Just as chemicals change human behavior, they change spider behavior as well! Effects of drugs on spiders have been studied since the 1940s. Dr. Peter Witt first discovered that chemicals change spider web construction. Peter gave caffeine, and a few other drugs, to spiders to see if they would build their webs during the day instead of at night, which is when they usually work. After giving his test spiders some of the drugs, the spiders still created their webs at night. However, he noticed something unexpected – the web structure of spiders on drugs was completely different from normal webs. The webs were different sizes and had more spacing between each thread. Normal webs help spiders to easily catch prey. Irregularly shaped webs were not good at catching prey because insects could fly right through the large spaces. After his study, Peter knew that drugs were bad for spiders.
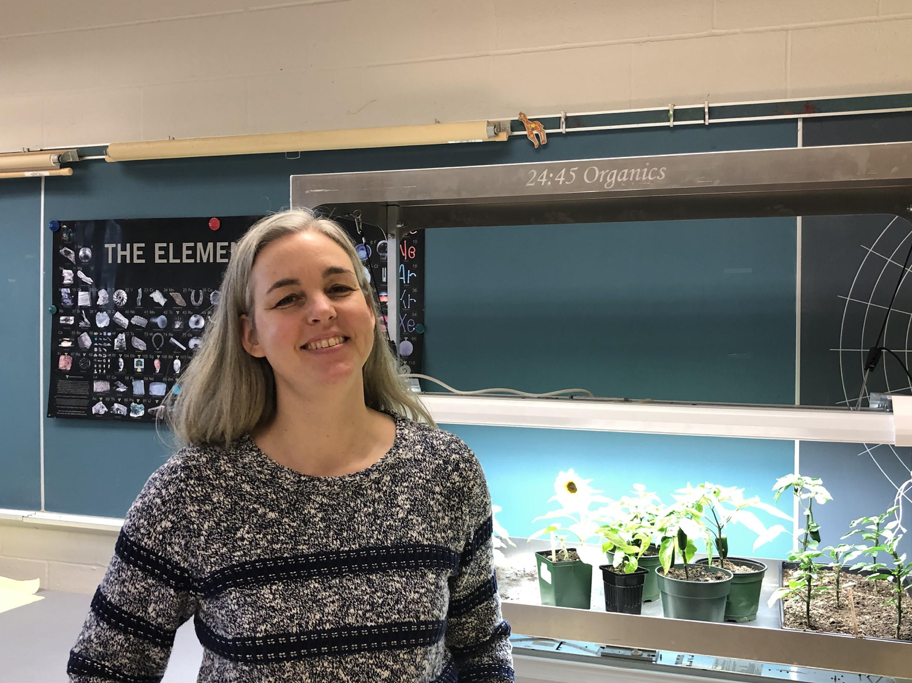
Chris (they/them), a current resident of Baltimore and a spider enthusiast, lives in a watershed that is affected by chemical pollution. They wanted to build on Peter’s research by looking at spider webs in the wild instead of in the lab. Chris knew that many types of spiders live near streams and are exposed to toxins through the prey they eat. Chris wanted to compare the effects of the chemicals on spiders in rural and urban environments. By comparing spider webs in these two habitats, they could see how changed the webs are and infer how many chemicals are in the waterways.
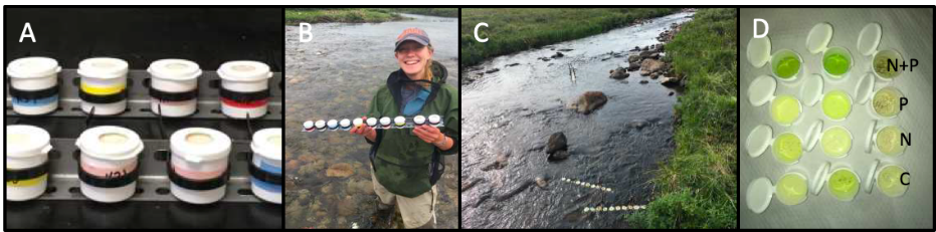
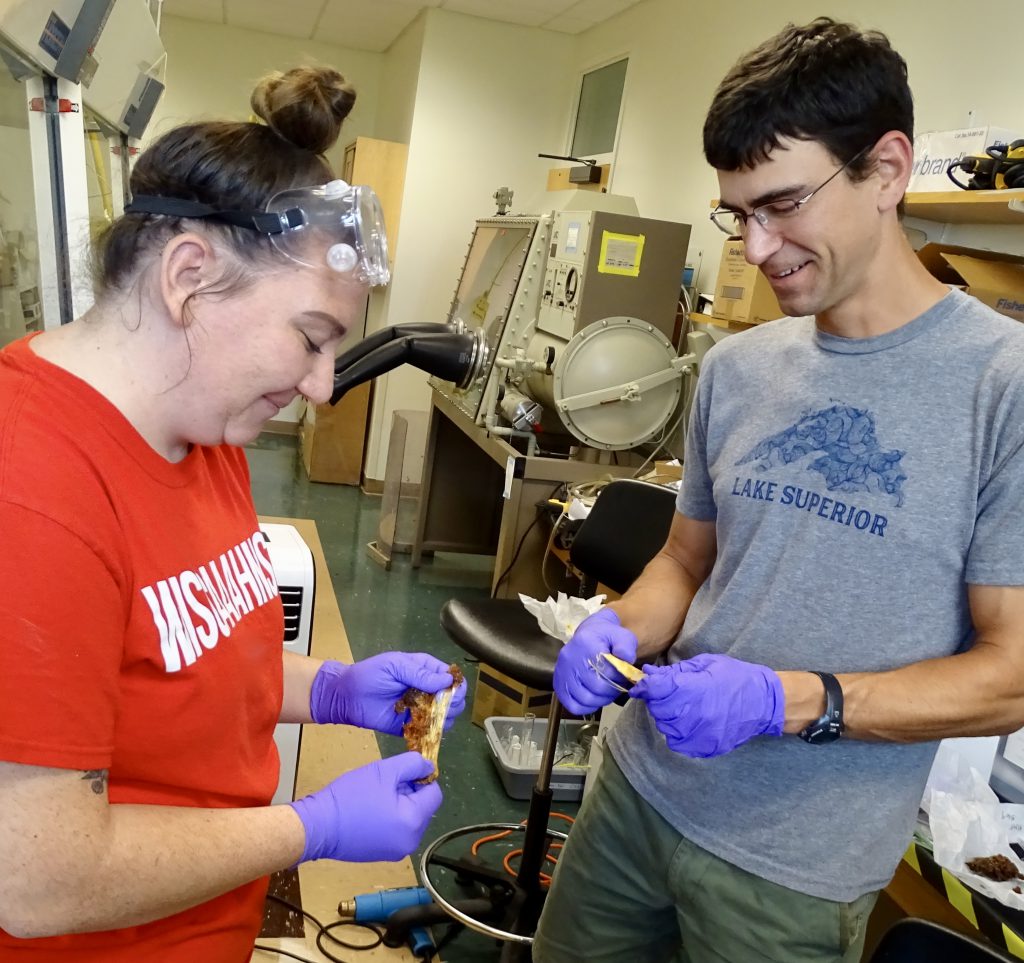
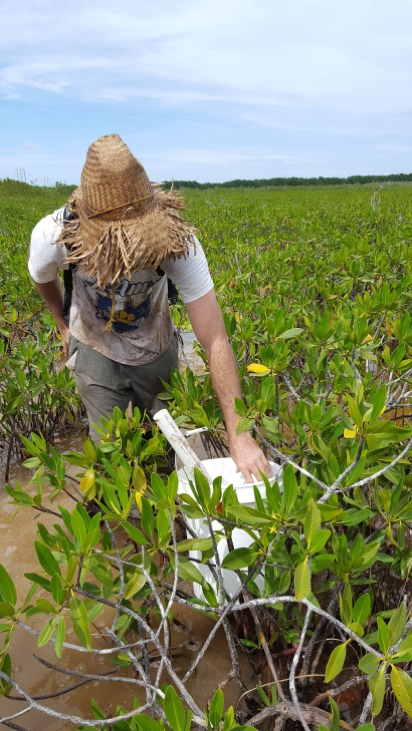
Chris worked with Aaron, a local high school teacher, to do this research. They collected images of spiderwebs in areas around Baltimore. They chose two sites: Baisman Run, a rural site far from the city, and Gwynns Run, an urban site close to the city. Chris traveled to the sites and took pictures of eight spiderwebs at each location. Chris and Aaron expected that urban streams would have higher concentrations of chemicals than rural areas because more people live in cities.
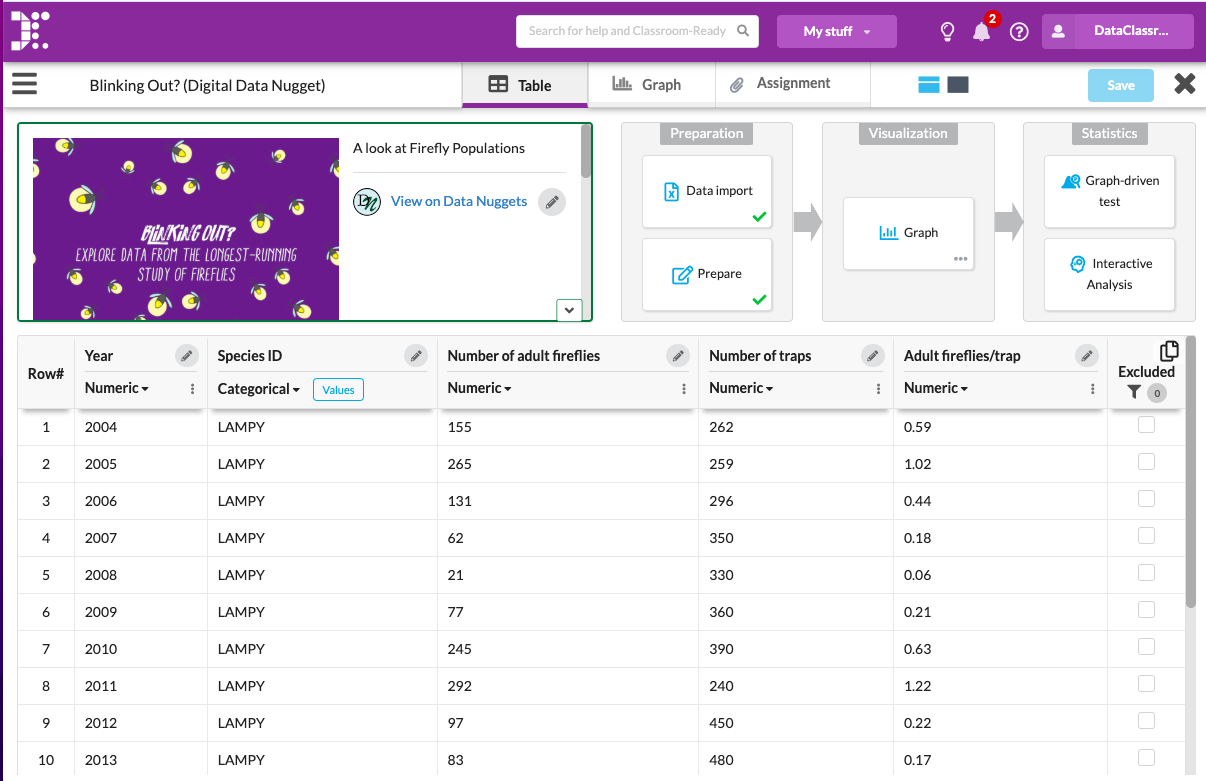
When they got back to the lab, Aaron took the pictures and used a computer program to count the number of cells and calculate the total area of each web. These data offer a glimpse into whether spiders near Baltimore are exposed to harmful pharmaceutical chemicals and personal care products. If spiders are exposed to these chemicals, the webs will have fewer, but larger cells than a normal web. The cells will also have irregular shapes.
Featured scientists: Chris Hawn from University of Maryland Baltimore County and Aaron Curry from Baltimore Ecosystem Study LTER
Flesch–Kincaid Reading Grade Level = 7.8
Additional teacher resources related to this Data Nugget include:
- You can watch Aaron describe his Research Experience for Teachers project here.