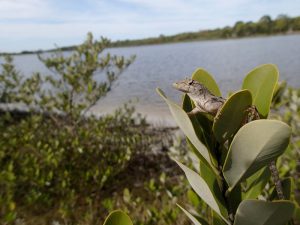
An anole lizard on the island, about to be captured by Aaron.
The activities are as follows:
- Teacher Guide
- Student activity, Graph Type A, Level 3
- Student activity, Graph Type B, Level 3
- Student activity, Graph Type C, Level 3
- PowerPoint of images and graphs
- Grading Rubric
- Digital Data Nugget on DataClassroom
When Charles Darwin talked about the “struggle for existence” he was making the observation that many individuals in the wild don’t survive long enough to reach adulthood. Many die before they have the chance to reproduce and pass on their genes to the next generation. Darwin also noted that in every species there is variation in physical traits such as size, color, and shape. Is it simply that those who survive to reproduce are lucky, or do these traits affect which individuals have a greater or lesser chance of surviving? Evolutionary biologists often work to see how differences in traits, such as body size, relate to differences in survival among individuals. When differences in traits are related to chances of survival, they are said to be under natural selection.
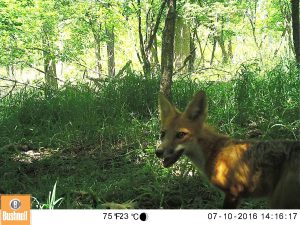
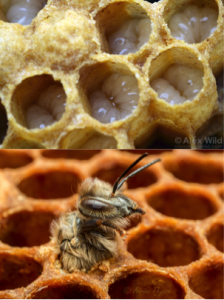
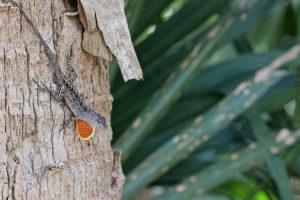
Brown anole lizards are useful for studies of natural selection because they are abundant in Florida and the Caribbean, easy to catch, and have a short life span. Brown anoles are very small when they hatch out of the egg. Because of their small size, these anole hatchlings are eaten by many different animals, including birds, crabs, other species of anole lizards, and even adult brown anoles! Predators could be a significant force of natural selection on brown anole hatchlings. Juvenile anoles that get eaten by predators will not survive to reproduce. Traits that help young brown anoles avoid predation and reproduce will get passed on to future generations.

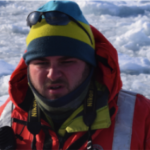
Aaron with a baby anole lizard.
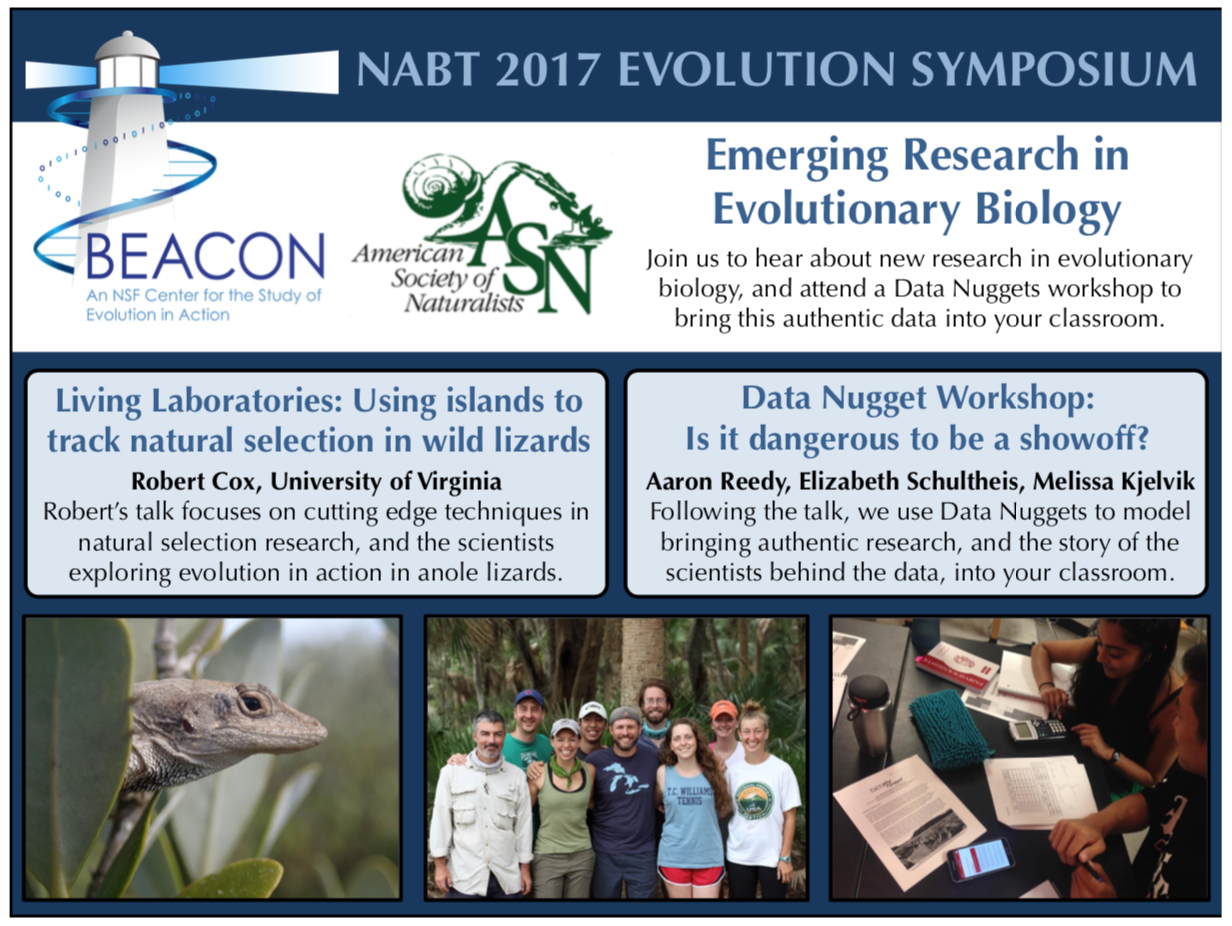
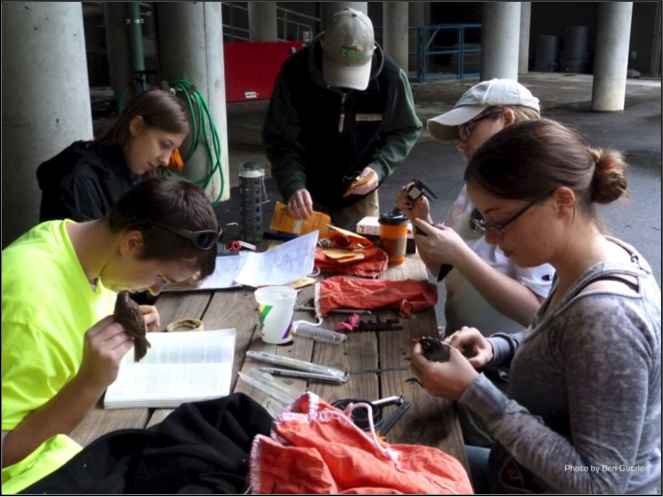
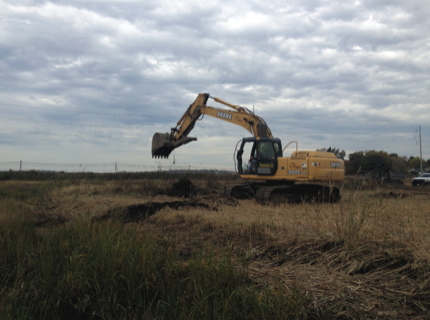
Aaron and Robert are scientists who study brown anoles on islands in Northeastern Florida. Along with their colleagues, they visit these islands every 6 to 10 weeks during the summer to survey the populations and measure natural selection in action. Aaron and Robert selected a small island that had a large brown anole population because they were able to find and measure all of the individuals on the island. Aaron observed that in the late summer there were thousands of hatchling lizards on the island, but by the middle of the summer the following year, only a few hundred of those lizards remained alive. He also observed that hatchlings varied greatly in body size and wondered if those differences in size affected the chances that an individual would survive to adulthood. He predicted that smaller hatchlings are more likely to die than larger ones because they are not as fast, and therefore not as likely to escape from predators and face a higher risk of being eaten.
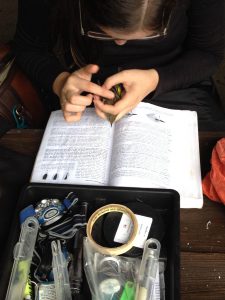
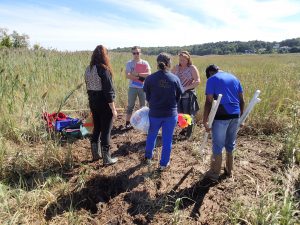
To test this, Aaron and Robert captured hatchlings in July, assigned a unique identification number to each anole, measured their body length, and then released them back onto the island. In October of the same year, they returned to the island to capture and measure all surviving lizards. They calculated the average percent survival for each size category. Aaron predicted longer individuals would have higher survival. This would indicate that there was natural selection for larger body size in hatchlings.
Featured scientists: Aaron Reedy and Robert Cox from the University of Virginia. Co-written by undergraduate researcher Matt Kustra.
Flesch–Kincaid Reading Grade Level = 11.7
Additional teacher resource related to this Data Nugget:
- For additional images of Robert and Aaron’s research with anoles in Florida, we have created PowerPoint slides that can be shown in class.
- Aaron conducted this research as a graduate student in Robert Cox’s lab. To learn more about anole research, visit the lab’s website. To learn more about Aaron, visit his website.
Once your students have completed this Data Nugget, check out this video on anole size and natural selection from hurricanes!
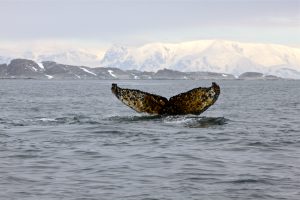
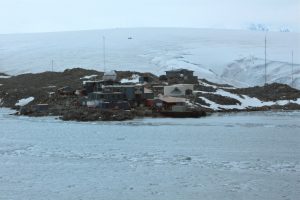
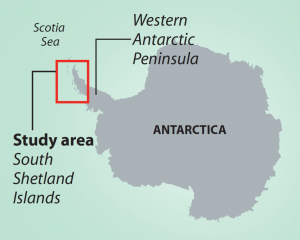 One geographic area that was over-exploited during times of high whaling was the South Shetland Islands along the Western Antarctic Peninsula (WAP). The WAP is in the southern hemisphere in Antarctica. Humpback whales migrate every year from the equator towards the south pole. In summer they travel 25,000 km (16,000 miles) south to WAP’s nutrient-rich polar waters to feed, before traveling back to the equator in the winter to breed or give birth. Today the WAP is experiencing one of the fastest rates of regional climate change with an increase in average temperatures of 6° C (10.8° F) since 1950. Loss of sea ice has been documented in recent years, along with reduced numbers of krill along the WAP.