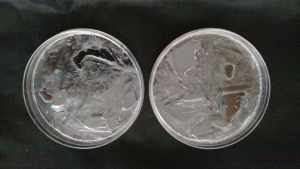
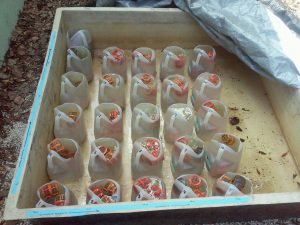
Magnesium sulfate crystals trapping liquid water.
The activities are as follows:
- Teacher Guide
- Student activity, Graph Type A, Level 2
- Student activity, Graph Type B, Level 2
- Student activity, Graph Type C, Level 2
- PowerPoint of images
- Grading Rubric
Is there life on other planets besides Earth? This question is not just for science fiction. Scientists are actively exploring the possibility of life beyond Earth. The field of astrobiology seeks to understand how life in the universe began and evolved, and whether life exists elsewhere. Our own solar system contains a variety of planets and moons. In recent years scientists have also discovered thousands of planets around stars other than our Sun. So far, none of these places are exactly like Earth. Many planets have environments that would be very difficult for life as we know it to survive. However, there are life forms that exist in extreme environments that we can learn from. On Earth there are extremely hot or acidic environments like volcanic hot springs. Organisms also live in extremely cold places like Antarctic glacier ice. Environments with extremely high pressure, like hydrothermal vents on the ocean floor, also support life. If life can inhabit these extreme environments here on Earth, might extreme life forms exist elsewhere in the universe as well?
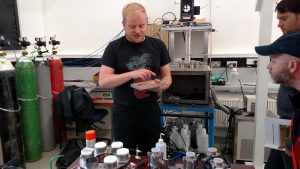
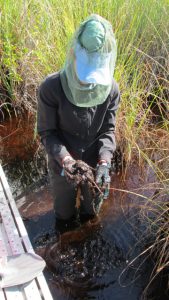
A view of the astrobiology lab.
Charles is an astrobiologist from Great Britain who is interested in finding life on other planets. The list of places that we might look for life grows longer every day. Charles thinks that a good place to start is right next door, on our neighboring planet, Mars. We know that Mars currently is cold, dry, and has a very thin atmosphere. Charles is curious to know whether there might still be places on Mars where life could exist, despite its extreme conditions.While there is no liquid water on the surface of Mars anymore, Mars once had a saltwater ocean covering much of its surface. The conditions on Mars used to be much more like Earth. Liquid water is essential for life as we know it. If there are places on Mars that still hold water, these could be great places to look for evidence of life. Charles thought that perhaps salt crystals, formed when these Martian oceans were evaporating, could trap pockets of liquid water.
Charles and his fellow researcher Nikki knew that there are a number of kinds of salts found in Martian soils, including chlorides, sulfates, perchlorates and others. They wanted to test their idea that water could get trapped when saltwater with these salts evaporate. They decided to compare the rate of evaporation for solutions with magnesium sulfate (MgSO4) with another commonsalt solution: sodium chloride, or table salt (NaCl). They chose to investigate these two salts because they are less toxic to life as we know it than many of the other chloride, perchlorate, or sulfate salts. Also, from reading the work of other scientists, Charles knows the Martian surface is particularly rich in magnesium sulfate.
Charles and Nikki measured precise quantities of saturated solutions of magnesium sulfate and sodium chloride and placed them into small containers. Plain water was used as a control. There were three replicate containers for each treatment – nine containers in total. They left the containers open to evaporate and recorded their mass daily. They kept collecting data until the mass stopped changing. At this point all of the liquid had evaporated or a salt crust had formed that was impermeable to evaporation. They then compared the final mass of the control containers to the other solutions. They also checked the resulting crusts for the presence or absence of permanent water-containing pockets. Charles and Nikki used these data to determine if either saltmakes crystals that can trap water in pockets when it evaporates.
Featured scientists: Charles Cockell, UK Centre for Astrobiology, University of Edinburgh, & Nikki Chambers, Astrobiology Teacher, West High School, Torrance, CA
Flesch–Kincaid Reading Grade Level = 8.7
Additional teacher resource related to this Data Nugget:
- We provided a slideshow with images to accompany this activity.
- The data provided in the activity is summarized, but the full dataset is available here if you would like students to work with it digitally.
- This Data Nugget is derived from a full lesson plan, written by Nikki, based on this research. The lesson plan is aligned to NGSS and is presented in 5E format. It allows students to do a simple replication of the salt crust experiment, with additional extensions.
- Article citation that describes the recent evidence which has shown that the Martian surface is particularly rich in magnesium sulfate (MgSO4).
- Article from space.com: “Follow the Salt: Search for Mars Life May Focus on Driest Regions“
- Article from Science Daily: “Searching salt for answers about life on Earth, Mars“
- Article from NASA Visualization Explorer: “Mars Evolution“
- Article from Atlas Obscura: “Cool, There’s Water on Mars. But Does It Make Good Pickles?”
- To learn more about the scientist behind this research, students can watch this short video about Dr. Charles Cockell.
- For a short video about the search for life on Mars, students can watch “Second Genesis” a PBS film about the search for life beyond Earth (focus on Mars and Enceladus) (18 min.)


 About Nora: Nora is currently an undergraduate getting her B.S. in Zoology with a concentration in Zoo and Aquarium as well as a minor in Marine Ecosystem Management from Michigan State University. Although aquatic life is her main interest, she think it’s important to appreciate other animal groups and take a break to play and explore the nature around you. That curiosity was how she was able to volunteer in labs on campus from entomology to genetics, and how she came to spend a summer at the Kellogg Biological Station in Michigan.