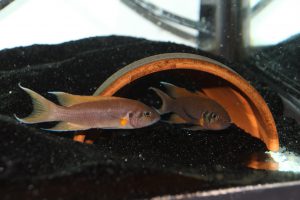
A male and female daffodil cichlid
The activities are as follows:
- Teacher Guide
- Student activity, Graph Type A, Level 4
- Student activity, Graph Type B, Level 4
- Student activity, Graph Type C, Level 4
- Grading Rubric
- Digital Data Nugget on DataClassroom
Have you ever thought about what it would be like to live completely alone, without contact with other people? Nowadays, humans are constantly connected by phones, texting, and social media. Our social interactions affect us in many unexpected ways. Strong social relationships can increase human lifespan, and lower the risk of cancer, cardiovascular disease, and depression. Social relationships are so important that they are actually a stronger predictor of premature death than smoking, obesity, or physical inactivity! Like humans, social interactions are important for other animals as well.
Jennifer is a behavioral ecologist who is interested in daffodil cichlids, a social species of fish from Lake Tanganyika, a Great Lake in Africa. Daffodil cichlids live in social groups of several small fish and one breeding pair. Each group defends its own rock cluster in the lake. The breeding male and female are the largest fist in the group, and the smaller fish help defend territory against predators and help care for newly hatched baby fish. About 200 social groups together make up a colony.
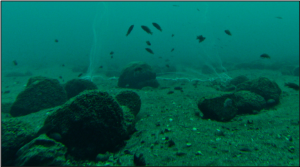
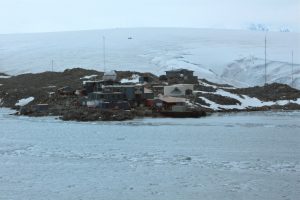
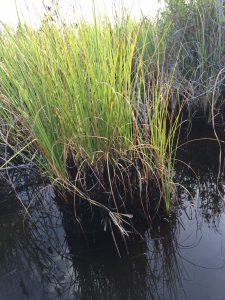
Social groups of daffodil cichlids in Lake Tanganyika
Behavior within a social group may be influenced by the presence of other groups in the colony. For example, neighboring groups can be a threat because they may try to take away territory or resources. After reading about previous research on social interactions in species that live in groups, Jennifer noticed there were very few studies that looked at how neighboring groups affected behavior within the group. Jennifer thought that the presence of neighboring groups may force the breeding pair to be less aggressive towards each other and work together to protect their group’s resources against the outside threat.
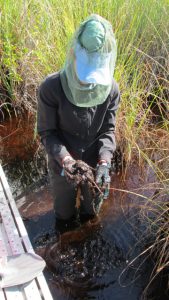
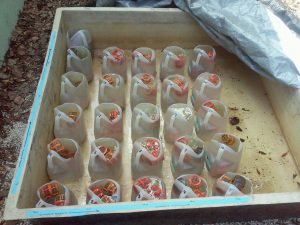
To test her idea, Jennifer formed breeding pairs of daffodil cichlids in an aquarium laboratory. She first observed the breeding pairs for any aggressive behaviors when they were isolated and could not see other groups. She observed each group for 30 minutes a day for 10 days. Next, Jennifer set up a clear barrier between the breeding pair and a neighboring group. The fish could see each other but not physically interact. Jennifer again watched the breeding pair and documented any aggressive behaviors to see how the presence of a neighboring group affected conflict within the pair. She again observed each group with neighbors for 30 minutes a day for 10 days.
During these behavioral tests, Jennifer counted the total number of behaviors done by the breeding pair. She measured several behaviors. Physical attacks were counted every time contact between the fish was made (biting or ramming each other). Aggressive displays were counted when fish give signals of aggression without making physical contact (raising their fins or swimming rapidly at another fish). Submissive behaviors, or actions used to prevent aggression between the breeding pair, were also counted. Finally, behaviors used to encourage social bonding were counted and are called affiliative behaviors. Jennifer predicted that the breeding pair would perform fewer physical attacks and aggressive displays when a neighboring group was present compared to when the breeding pair was alone. She also thought the breeding pair would perform more submissive and affiliative behaviors when the neighboring group was present. In this way, the presence of an outside group would impact the behaviors within a group.
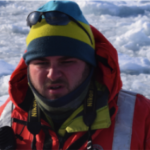
Featured scientist: Jennifer Hellmann from The Ohio State University


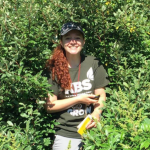 About Nora: Nora is currently an undergraduate getting her B.S. in Zoology with a concentration in Zoo and Aquarium as well as a minor in Marine Ecosystem Management from Michigan State University. Although aquatic life is her main interest, she think it’s important to appreciate other animal groups and take a break to play and explore the nature around you. That curiosity was how she was able to volunteer in labs on campus from entomology to genetics, and how she came to spend a summer at the Kellogg Biological Station in Michigan.

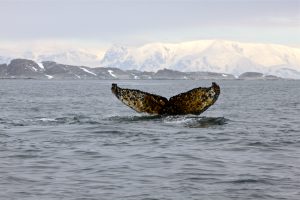
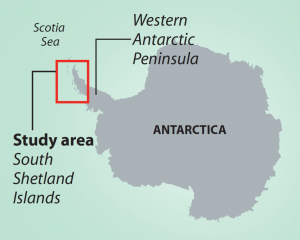 One geographic area that was over-exploited during times of high whaling was the South Shetland Islands along the Western Antarctic Peninsula (WAP). The WAP is in the southern hemisphere in Antarctica. Humpback whales migrate every year from the equator towards the south pole. In summer they travel 25,000 km (16,000 miles) south to WAP’s nutrient-rich polar waters to feed, before traveling back to the equator in the winter to breed or give birth. Today the WAP is experiencing one of the fastest rates of regional climate change with an increase in average temperatures of 6° C (10.8° F) since 1950. Loss of sea ice has been documented in recent years, along with reduced numbers of krill along the WAP.