The activities are as follows:
- Teacher Guide
- Student activity, Graph Type A, Level 3
- Student activity, Graph Type B, Level 3
- Student activity, Graph Type C, Level 3
- PowerPoint of Images
- Grading Rubric
- Digital Data Nugget on DataClassroom
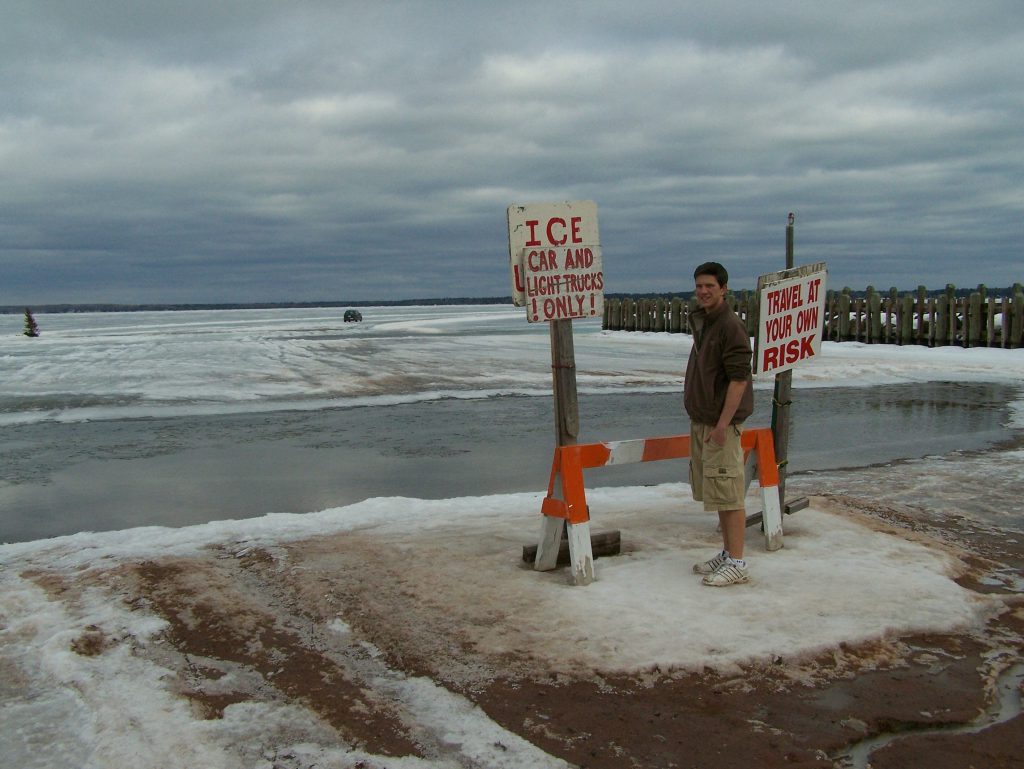
As a boy growing up in Bayfield, Wisconsin, Forrest was familiar with the seasonal rhythms of Lake Superior and the nearby Apostle Islands. Forrest watched each year as ice formed in the Bayfield Harbor, stopping the boat traffic each winter. Eventually, as the ice thickened even more, an ice road would open between Bayfield and LaPointe. The small town of LaPointe is located on Madeline Island just over two miles from the shore of Bayfield. When the ice road opens, it frees the island residents from working around the ferry schedule and they can drive on the ice to get to the mainland.
As a senior at Bayfield High School, Forrest became interested in conducting a scientific study related to the ice season on Lake Superior. He knew that Lake Superior plays a vital role in the lives of people who live and work on its shores and therefore all sorts of data are recorded to help understand and take care of it. Based on his own observations and comments of other area residents, Forrest thought that winters were getting shorter. He wanted to know whether the length of the ice season was changing over time. Forrest turned to historical data to answer his question.
Forrest’s first stop on his quest to find data was the Madeline Island Ferry Line, a company that operates the ferries between Bayfield and LaPointe. Since 1970, the ferry line has kept yearly records of the date on which the last ferry traveled between Bayfield and LaPointe before the water was too frozen for travel. They also recorded the date on which the first ferry traveled the channel when ice melted in the spring. That gave Forrest a start, but he wanted data that would date farther back than 1970.
Luckily, Forrest’s father, Neil, was an interpretive ranger for the Apostle Islands National Lakeshore. Neil showed Forrest local newspaper archives that were stored in the basement of their headquarters building. News about shipping and fishing have been important to the people in the community throughout history, so it was common to find articles referencing the first and last boat of each year. Looking back through newspaper records, Forrest and Neil were able to collect data for almost every year dating back to 1857!
Armed with these data, Forrest began his analyses. He chose to define the length of the ice season as the time between the last boat each winter and the first boat each spring. This also represents the time during which there was no boat navigation due to ice cover. Forrest’s next step was to choose how to quantify the dates. He decided to use Julian dates, which start with January 1 as Day 1 and continue to count up by 1 for each day. This means that January 31 would be Day 31, February 1 would be Day 32, and March 1 would be Day 61. After assigning Julian dates to each historical data point, Forrest subtracted the day of the last boat from the day of the first boat to find the number of days without boat traffic each year. This number serves as a consistent way to estimate the length of the ice season each year. Winter begins in one calendar year but ends in the next, so Forrest identified the year based on the calendar year that the winter began.
Featured scientist: Forrest Howk, Bayfield High School. Written by: Richard Erickson, Bayfield High School and Hannah Erickson, Boston Public Schools
Flesch–Kincaid Reading Grade Level = 10.1
Additional teacher resources related to this Data Nugget include:
- If you would like your students to interact with the raw data, we have attached the original data here.
- Forrest’s study was published in the Journal of Great Lakes Research.
- Howk, Forrest. (2009). Changes in Lake Superior Ice Cover at Bayfield, Wisconsin. Journal of Great Lakes Research. 35. 159-162.
- Scientists at the Large Lakes Observatory in Duluth, MN have conducted studies related to Lake Superior’s water temperatures. This website includes real-time data collection from buoys in Lake Superior that would likely yield usable data for student investigations.
- Dr. John Magnuson of the University of Wisconsin has conducted studies of ice cover for lakes at latitudes across the globe. He wrote an article about projected changes in ice cover due to climate change at various latitudes around the world. In addition, his website has links to publications and further information.