The birds of Hubbard Brook, Part I

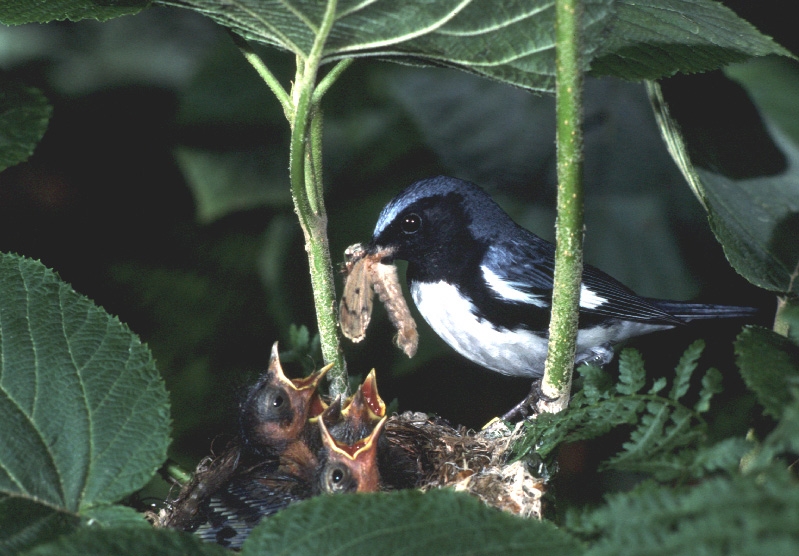
Male Black-throated Blue Warbler feeding nestlings. Nests of this species are built typically less than one meter above ground in a shrub such as hobblebush. Photo by N. Rodenhouse.

Male Black-throated Blue Warbler feeding nestlings. Nests of this species are built typically less than one meter above ground in a shrub such as hobblebush. Photo by N. Rodenhouse.

The activities are as follows:

The Hubbard Brook Experimental Forest is an area where scientists have collected ecological data for many years. It is located in the White Mountains of New Hampshire. Data collected in this forest helps uncover environmental trends over long periods of time, such as changes in air temperature, precipitation, forest growth, and animal populations. It is important to collect data on ecosystems over time because these patterns could be missed with shorter observation periods or short-term experiments.

Richard Holmes is an avian ecologist who began this study because he was interested in how bird populations were responding to long-term environmental change.

Richard Holmes is an avian ecologist who began this study because he was interested in how bird populations were responding to long-term environmental change.

Each spring, Hubbard Brook comes alive with the arrival of migratory birds. Many come from the tropics to take advantage of abundant insects and the long summer days of northern areas. In the spring, avian ecologists, or scientists who study the ecology of birds, also become active in the forest at Hubbard Brook. They have been keeping records on the birds that live in the experimental forest for over 50 years. These data are important because they represent one of the longest bird studies ever conducted!

Richard is an avian ecologist who began this study early in his career as a scientist. He was interested in how bird populations respond to long-term environmental changes at Hubbard Brook. Every summer since 1969, Richard takes his team of trained scientists, students, and technicians into the field to identify which species are present. Richard’s team monitors populations of over 30 different bird species. They count the number of birds that are in the forest each year and study their activities during the breeding season. The researchers wake up every morning before the sun rises and travel to the far reaches of the forest. They listen for, look for, identify, and count all the birds they find. The team has been trained to be able to identify the birds by sight, but also by their calls. Team members are even able to identify how far away a bird is by hearing its call!

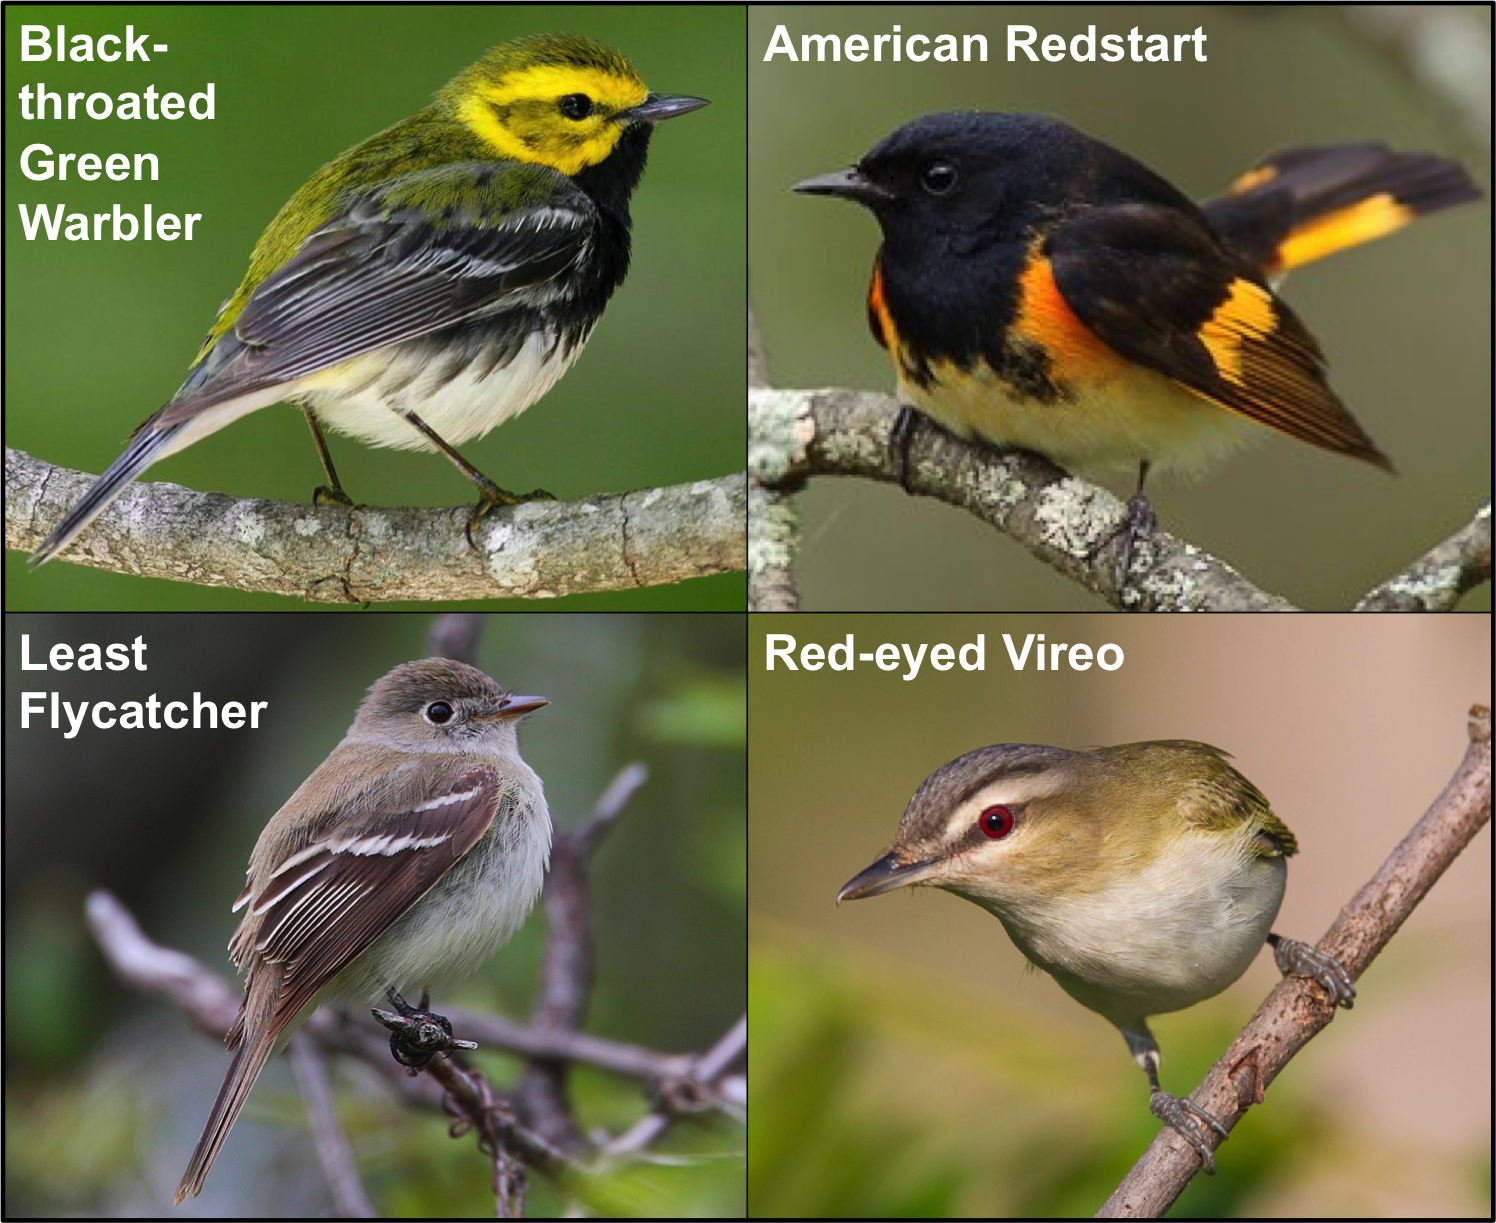
The study area is located away from any roads or other disturbed areas. To measure the abundance, or number of birds found in the 10 hectare study area, the researchers used what is called the spot-mapping method. They use plastic flags on trees 50 meters apart throughout the study area to create a 50×50 meter grid. The grid allows them to map where birds are found in this area, and when possible, where they locate their nests. Using the grid the researchers systematically walk through the plot several days each week from early May until July, recording the presence and activities of every bird they find. They also note the locations of nearby birds singing at the same time. These records are combined on a map to figure out a bird’s territory, or activity center. At the end of the breeding season they count up the number of territories to get an estimate of the number of birds on the study area. This information, when paired with observations on the presence and activities of mates, locations of nests, and other evidence of breeding activity provide an accurate estimate for bird abundance. Finally, some species under close study, like American Redstart and Black-throated Blue Warbler, were captured and given unique combinations of colored bands, which makes it easier to track individuals.

By looking at bird abundance data across many years, Richard and his colleagues can identify trends that reveal how avian populations change over time.

Featured scientist: Richard Holmes from the Hubbard Brook Experimental Forest. Data Nugget written by: Sarah Turtle and Jackie Wilson.

Flesch–Kincaid Reading Grade Level = 11.3

A view of the Hubbard Brook Experimental Forest

A view of the Hubbard Brook Experimental Forest

Additional teacher resource related to this Data Nugget:

There are multiple publications related to the data included in this activity:

  • Holmes, R. T. 2011. Birds in northern hardwoods ecosystems: Long-term research on population and community processes in the Hubbard Brook Experimental Forest. Forest Ecology and Management doi:10.1016/j.foreco.2010.06.021.
  • Holmes, R.T., 2007. Understanding population change in migratory songbirds: long-term and experimental studies of Neotropical migrants in breeding and wintering areas. Ibis 149 (Suppl. 2), 2-13.
  • Townsend, A. K., et al. (2016). The interacting effects of food, spring temperature, and global climate cycles on population dynamics of a migratory songbird. Global Change Biology 2: 544-555.
SaveSave

SaveSave

SaveSave

SaveSave

SaveSave

SaveSave

Lizards, iguanas, and snakes! Oh my!

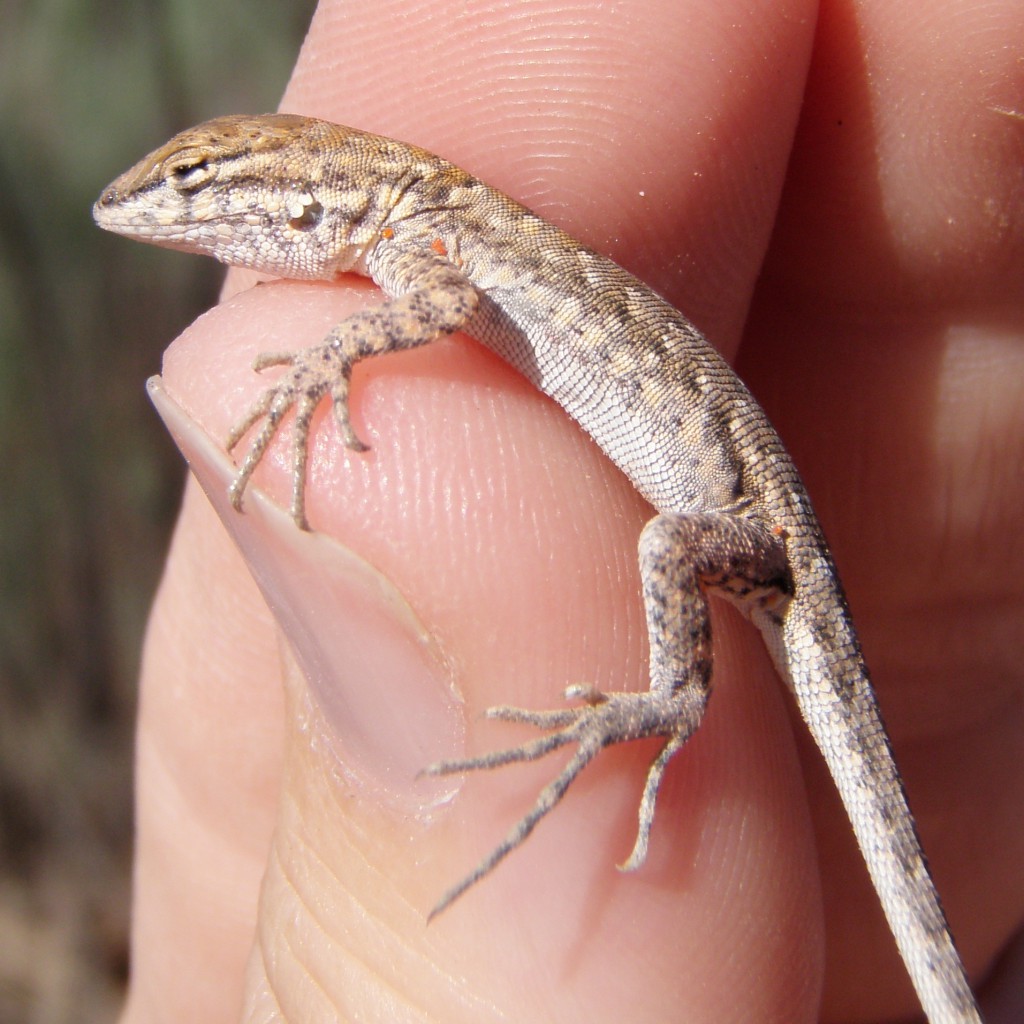
The Common Side-blotched Lizard

The Common Side-blotched Lizard

The activities are as follows:

Throughout history people have settled mainly along rivers and streams. Easy access to water provides resources to support many people living in one area. In the United States today, people have settled along 70% of rivers.

Today, rivers are very different from what they were like before people settled near them. The land surrounding these rivers, called riparian habitats, has been transformed into land for farming, businesses, or housing for people. This urbanization has caused the loss of green spaces that provide valuable services, such as water filtration, species diversity, and a connection to nature for people living in cities. Today, people are trying to restore green spaces along the river to bring back these services. Restoration of disturbed riparian habitats will hopefully bring back native species and all the other benefits these habitats provide.

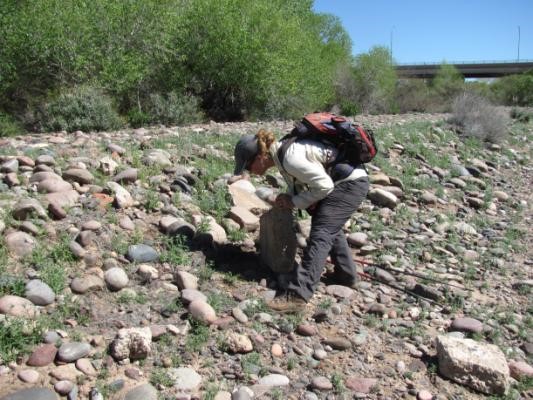
Scientist Mélanie searching for reptiles in the Central Arizona-Phoenix LTER.

Scientist Mélanie searching for reptiles in the Central Arizona-Phoenix LTER.

Scientists Heather and Mélanie are researchers with the Central Arizona-Phoenix Long-Term Ecological Research (CAP LTER) project. They want to know how restoration will affect animals living near rivers. They are particularly interested in reptiles, such as lizards. Reptiles play important roles in riparian habitats. Reptiles help energy flow and nutrient cycling. This means that if reptiles live in restored riparian habitats, they could increase the long-term health of those habitats. Reptiles can also offer clues about the condition of an ecosystem. Areas where reptiles are found are usually in better condition than areas where reptiles do not live.

Heather and Mélanie wanted to look at how disturbances in riparian habitats affected reptiles. They wanted to know if reptile abundance (number of individuals) and diversity (number of species) would be different in areas that were more developed. Some reptile species may be sensitive to urbanization, but if these habitats are restored their diversity and abundance might increase or return to pre-urbanization levels. The scientists collected data along the Salt River in Arizona. They had three sites: 1) a non-urban site, 2) an urban disturbed site, and 3) an urban rehabilitated site. They counted reptiles that they saw during a survey. At each site, they searched 21 plots that were 10 meters wide and 20 meters long. The sites were located along 7 transects, or paths measured out to collect data. Transects were laid out along the riparian habitat of the stream and there were 3 plots per transect. Each plot was surveyed 5 times. They searched for animals on the ground, under rocks, and in trees and shrubs.

Featured scientists: Heather Bateman and Mélanie Banville from Arizona State University. Written by Monica Elser from Arizona State University.

Flesch–Kincaid Reading Grade Level = 9.8

Check out this video of Heather and her lab out in the field collecting lizards:

Virtual field trip to the Salt River biodiversity project:

Additional resources related to this Data Nugget:

SaveSave

SaveSave

SaveSave

The mystery of Plum Island Marsh

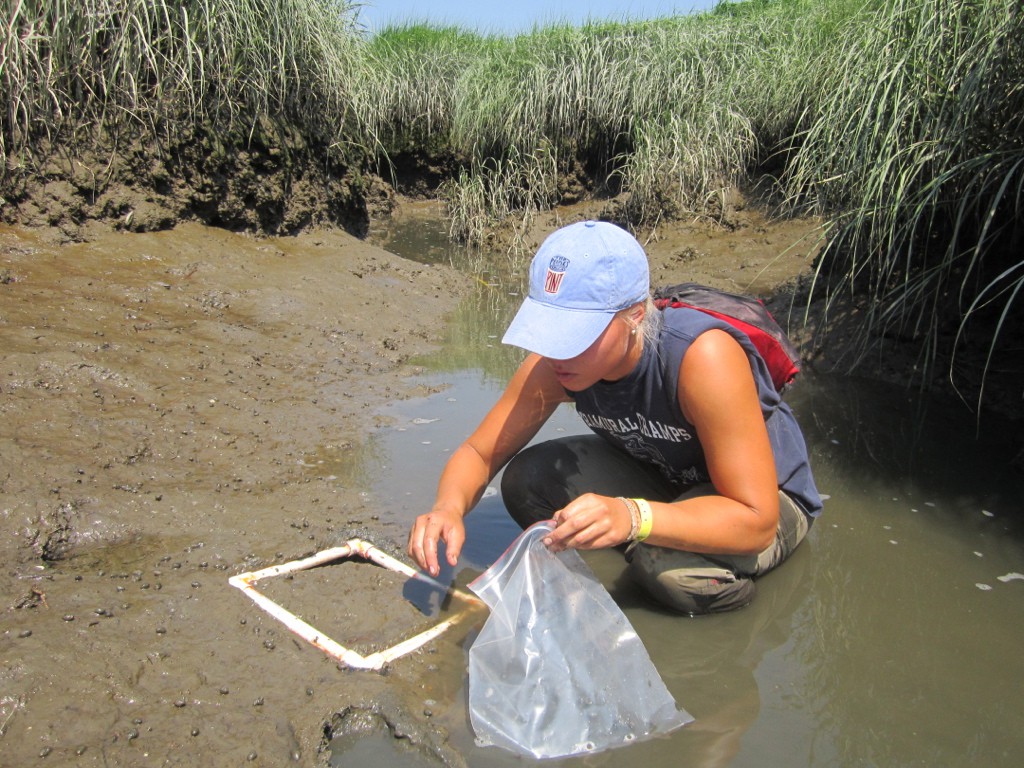
Scientist, Harriet Booth, counting and collecting mudsnails from a mudflat at low tide.

Scientist, Harriet Booth, counting and collecting mudsnails from a mudflat at low tide.

The activities are as follows:

Salt marshes are among the most productive coastal ecosystems. They support a diversity of plants and animals. Algae and marsh plants use the sun’s energy to make sugars and grow. They also feed many invertebrates, such as snails and crabs, which are then eaten by fish and birds. This flow of energy through the food web is important for the functioning of the marsh. Also important for the food web is the cycle of matter and nutrients. The waste from these animals, and eventually their decaying bodies, recycle matter and nutrients, which can be used by the next generation of plants and algae. Changes in any links in the food chain can have cascading effects throughout the ecosystem.

Today, we are adding large amounts of fertilizers to our lawns and agricultural areas. When it rains, these nutrients run off into our waterways, ponds, and lakes. If the added nutrients end up in marshes, marsh plants and algae can then use these extra nutrients to grow and reproduce faster. Scientists working at Plum Island Marsh wanted to understand how these added nutrients affect the marsh food web, so they experimentally fertilized several salt marsh creeks for many years. In 2009, they noticed that fish populations were declining in the fertilized creeks.

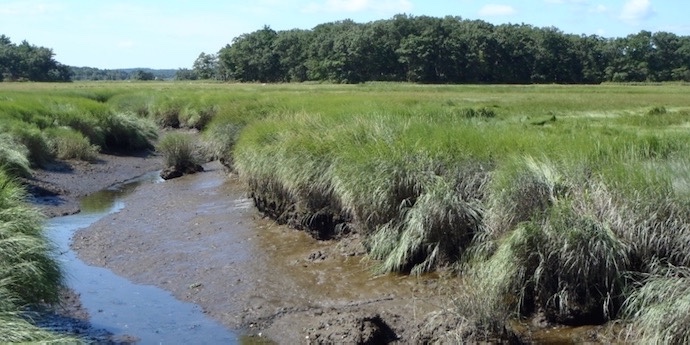
View of a Plum Island salt marsh.

View of a Plum Island salt marsh.

Fertilizer does not have any direct effect on fish, so the scientists wondered what the fertilizer could be changing in the system that could affect the fish. That same year they also noticed that the mudflats in the fertilized creeks were covered in mudsnails, far more so than in previous years. These mudsnails eat the same algae that the fish eat, and they compete for space on the mudflats with the small invertebrates that the fish also eat. The scientists thought that the large populations of mudsnails were causing the mysterious disappearance of fish in fertilized creeks by decreasing the number of algae and invertebrates in fertilized creeks.

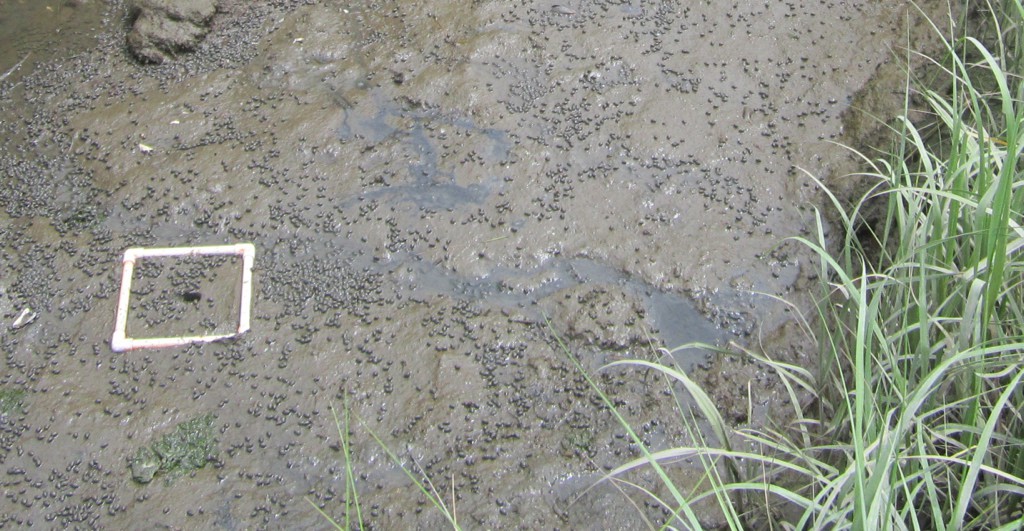
A few years later, Harriet began working as one of the scientists at Plum Island Marsh. She was interested in the mudsnail hypothesis, but there was yet no evidence to show the mudsnails were causing the decline in fish populations. She decided to collect some data. If mudsnails were competing with the invertebrates that fish eat, she expected to find high densities of mudsnails and low densities of invertebrates in the fertilized creeks. In the summer of 2012, Harriet counted and collected mudsnails using a quadrat (shown in the photo) and took cores down into the mud to measure the other invertebrates in the mudflats of the creeks. She randomly sampled 20 locations along a 200-meter stretch of creek at low tide. The data she collected are found below and can help determine whether mudsnails are responsible for the disappearance of fish in fertilized creeks.

Mudsnails on a mudflat, and the quadrat used to study their population size.

Mudsnails on a mudflat, and the quadrat used to study their population size.

Featured scientist: Harriet Booth from Northeastern University

Flesch–Kincaid Reading Grade Level = 10.2

Click here for a great blog post by Harriet detailing her time spent in the salt marsh: Harriet Booth: Unraveling the mysteries of Plum Island’s marshes

If your students are looking for more information on trophic cascades in salt marsh ecosystems, check out the video below!

SaveSave

SaveSave

SaveSave

SaveSave

Is chocolate for the birds?

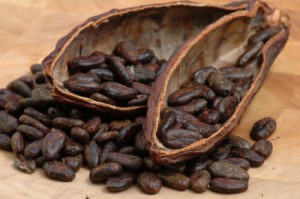
Cocoa beans used to make chocolate!

Cocoa beans used to make chocolate!

The activities are as follows:

About 9,000 years ago humans invented agriculture as a way to grow enough food for people to eat. Today, agriculture happens all over the globe and takes up 40% of Earth’s land surface. To make space for our food, humans must clear large areas of land, which creates a drastic change, or disturbance, to the habitat. This land-clearing disturbance removes the native plants already there including trees, small flowering plants, and grasses. Many types of animals including mammals, birds, and insects depend on these native plants for food or shelter. Large scale disturbances can make it difficult to live in the area. For example, a woodpecker bird cannot live somewhere that has no trees because they live and find their food in the trees.

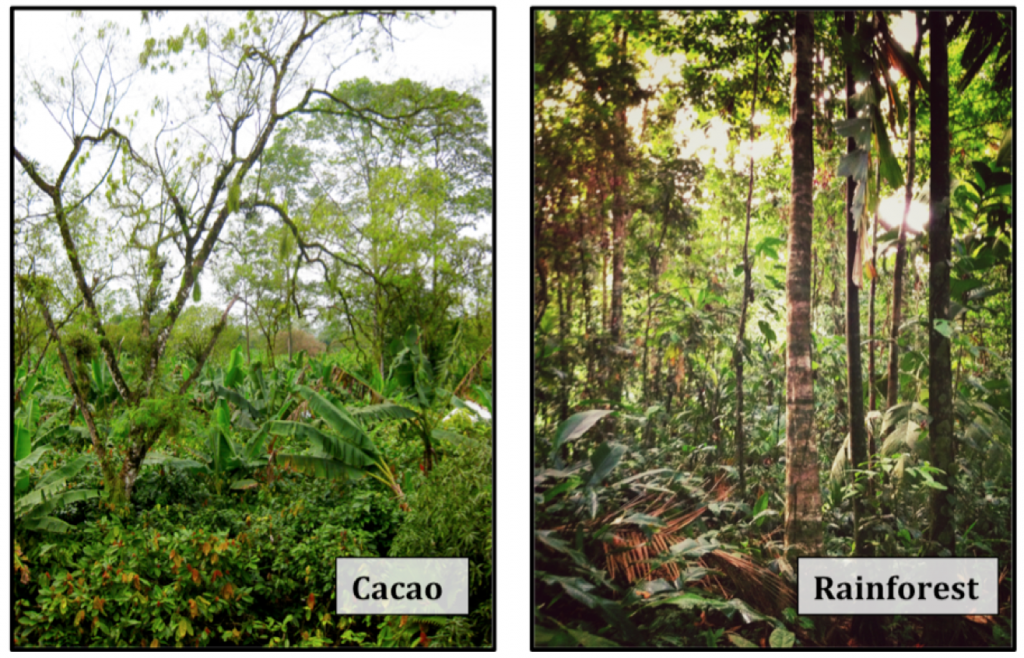
However, some agriculture might help some animals because they can use the crops being grown for the food and shelter they need to survive. One example is the cacao tree, which grows in the rainforests of South America. Humans use the seeds of this plant to make chocolate, so it is a very important crop! Cacao trees need very little light. They grow best in a unique habitat called the forest understory, which is composed of the shorter trees and bushes under the large trees found in rainforests. To get a lot of cacao seeds for chocolate, farmers need to have large rainforest trees above their cacao trees for shade. In many ways, cacao farms resemble a native rainforest. Many native plant species grow there and there are still taller tree species. However, these farms are different in important ways from a native rainforest. For example, there are many more short understory trees in the farm than there are in native rainforests. Also, there are fewer small flowering plants on the ground because humans that work on cacao farms trample them as they walk around the farm.

rainforest and cacao plantation

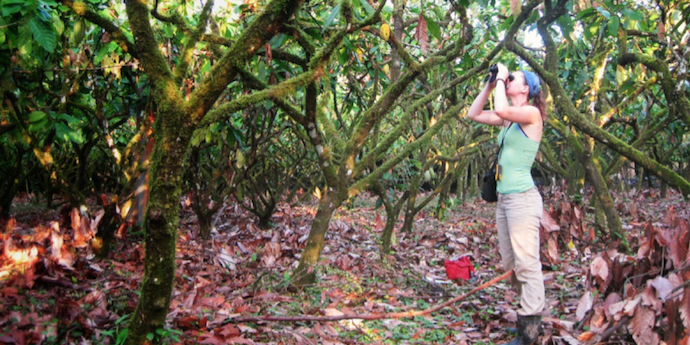
Part I: Skye is a biologist who wanted to know whether rainforest birds use the forest when they are disturbed by adding cacao farms. Skye predicted she would see many fewer birds in the cacao farms, compared to the rainforest. To measure bird abundance, she simply counted birds in each habitat. To do this she chose one rainforest and one cacao farm and set up two transects in each. Transects are parallel lines along which the measurements are taken. She spent four days counting birds along each transect, for a total of eight days in each habitat. She had to get up really early and count birds between 6:00 and 9:00 in the morning because that’s when they are most active.

Part II: Skye was shocked to see so many birds in cacao farms! She decided to take a closer look at her data. Skye wanted to know how the types of birds she saw in the cacao farms compared to the types of birds she saw in the rainforest. She predicted that cacao farms would have different types of birds than the undisturbed rainforest. She thought the bird types would differ because each habitat has different types of food available for birds to eat and different types of plants for birds to live in.

Skye broke her abundance data down to look more closely at four types of birds:

  1. Toucans (Eat: large insects and fruit from large trees, Live: holes in large trees)
  2. Hummingbirds (Eat: nectar from flowers, Live: tree branches and leaves)
  3. Wrens (Eat: small insects, Live: small shrubs on the forest floor)
  4. Flycatchers (Eat: Small insects, Live: tree branches and leaves)

skyecacao

Featured scientist: Skye Greenler from Colorado College and Purdue University

Flesch–Kincaid Reading Grade Level = 8.5

Additional teacher resources related to this Data Nugget:

  • The research described in this activity has been published. The citation and a PDF of the scientific paper can be found here:
  • The complete dataset for the study has been published to a data repository and is available for classroom use. This dataset has even more data than what is in the Data Nugget activity. While the Data Nugget has data for just two habitats (cacao and rainforest), the full dataset also includes two other agroforest habitat types. The dataset also includes data for every species (169) recorded during the study, whereas the Data Nugget only has data for four families (toucans, wrens, flycatchers, hummingbirds).
  • Study Location: Skye’s study took place in a 10 km2 mixed rainforest, pasture, agro-forest, and monoculture landscape near the village of Pueblo Nuevo de Villa Franca de Guácimo, Limón Province, Costa Rica (10˚20˝ N, 83˚20˝ W), in the Caribbean lowlands 85 km northeast of San José.
  • For more background on the importance of biodiversity, students can eat this article in The Guardian – What is biodiversity and why does it matter to us?

About Skye: As a child Skye was always asking why; questioning the behavior, characteristics, and interactions of plants and animals around her.  She spent her childhood reconstructing deer skeletons to understand how bones and joints functioned and creating endless mini-ecosystems in plastic bottles to watch how they changed over time.  This love of discovery, observation, questioning, and experimentation led her to many technician jobs, independent research projects, and graduate research study at Purdue University.  At Purdue she studies the factors influencing oak regeneration after ecologically based timber harvest and prescribed fire.  While Skye’s primary focus is ecological research, she loves getting to leave the lab and bring science into classrooms to inspire the next generation of young scientists and encourage all students to be always asking why!
SaveSave

SaveSave

SaveSave

SaveSave

SaveSave

SaveSave

SaveSave

SaveSave

SaveSave

SaveSave

SaveSave

SaveSave

Do invasive species escape their enemies?

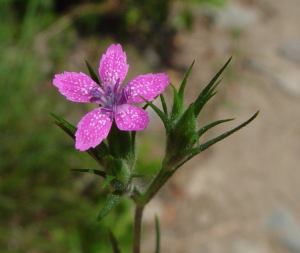
One of the invasive plants found in the experiment, Dianthus armeria

One of the invasive plants found in the experiment, Dianthus armeria

The activities are as follows:

Invasive species, like zebra mussels and garlic mustard, are species that have been introduced by humans to a new area. Where they invade they cause harm. For example, invasive species outcompete native species and reduce diversity, damage habitats, and interfere with human interests. Damage from invasive species costs the United States over $100 billion per year.

Scientists want to know, what makes an invasive species become such a problem once it is introduced? Is there something that is different for an invasive species compared to native species that have not been moved to a new area? Many things change for an invasive species when it is introduced somewhere new. For example, a plant that is moved across oceans may not bring enemies (like disease, predators, and herbivores) along for the ride. Now that the plant is in a new area with no enemies, it may do very well and become invasive.

laulab

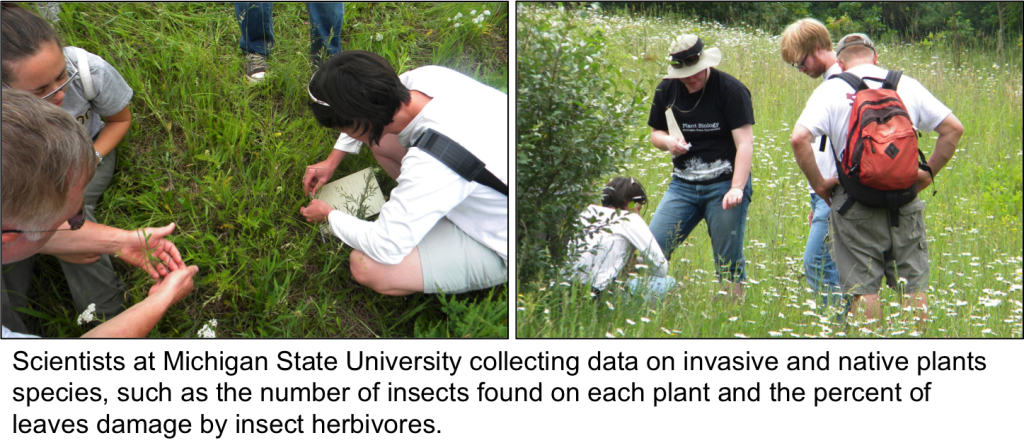
Scientists at Michigan State University wanted to test whether invasive species are successful because they have escaped their enemies. They predicted invasive species would get less damage from enemies, compared to native species that still live near to their enemies. If native plants have tons of insects that can eat them, while an invasive plant has few or none, this would support enemy escape explaining invasiveness. However, if researchers find that native and invasive species have the same levels of herbivory, this would no support enemy escape. To test this hypothesis, a lab collected data on invasive and native plant species in Kalamazoo County. They measured how many insects were found on each species of plant, and the percent of leaves that had been damaged by insect herbivores. The data they collected is found below and can be used to test whether invasive plants are successful because they get less damage from insects compared to native plants.

Featured scientist: Elizabeth Schultheis from Michigan State University

Flesch–Kincaid Reading Grade Level = 11.3

  • For a lesson plan on the Enemy Release Hypothesis, click here.
  • The Denver Museum of Nature and Science has a short video giving background on invasive species, here