When you were a child, what was your image of a scientist? Could you imagine yourself in those shoes?
A new, National Science Foundation-funded study led by Michigan State University researchers and others aims to better understand how science instruction that contains diverse scientist role models affects student attitudes about science, technology, engineering and mathematics—STEM—courses and careers.
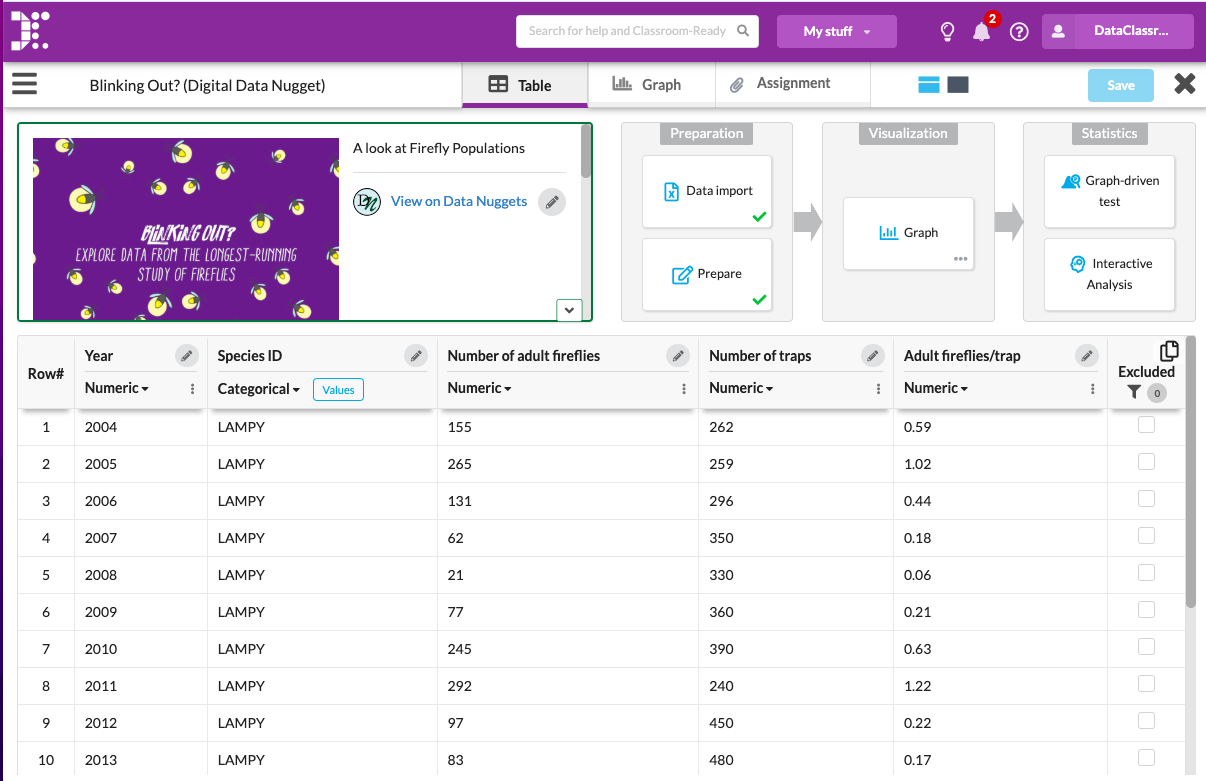
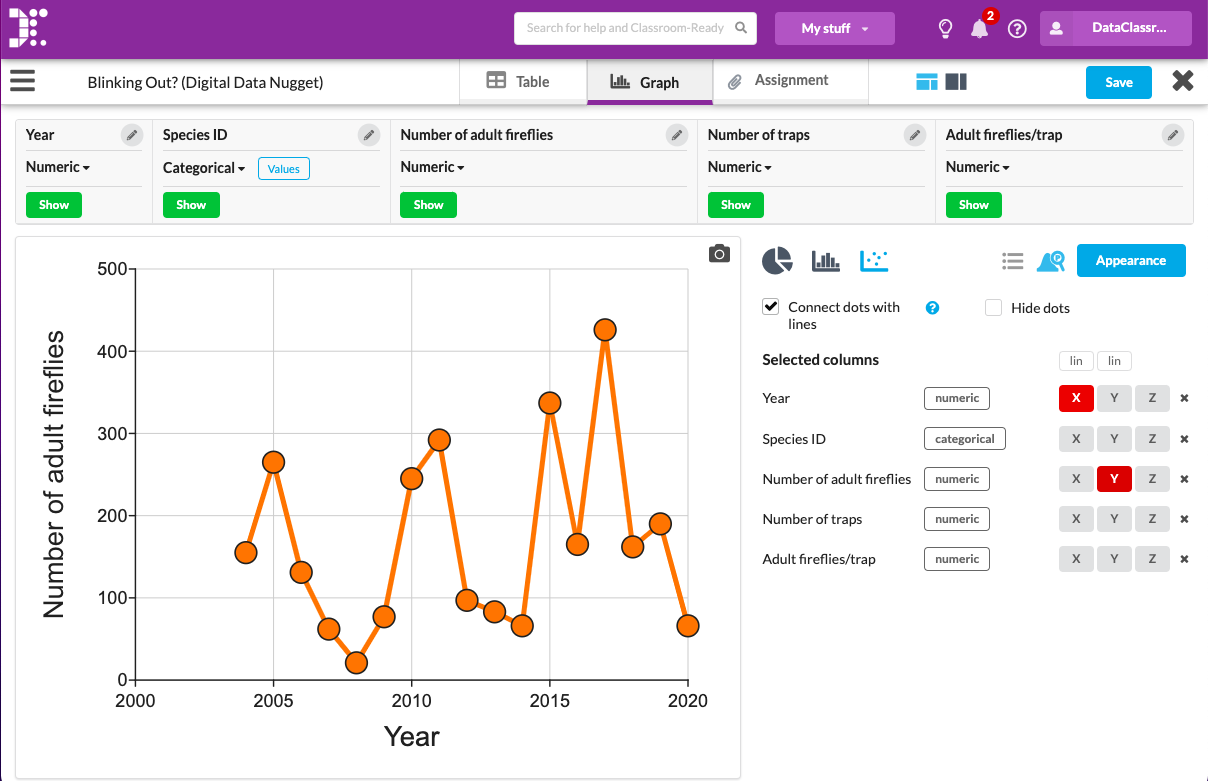
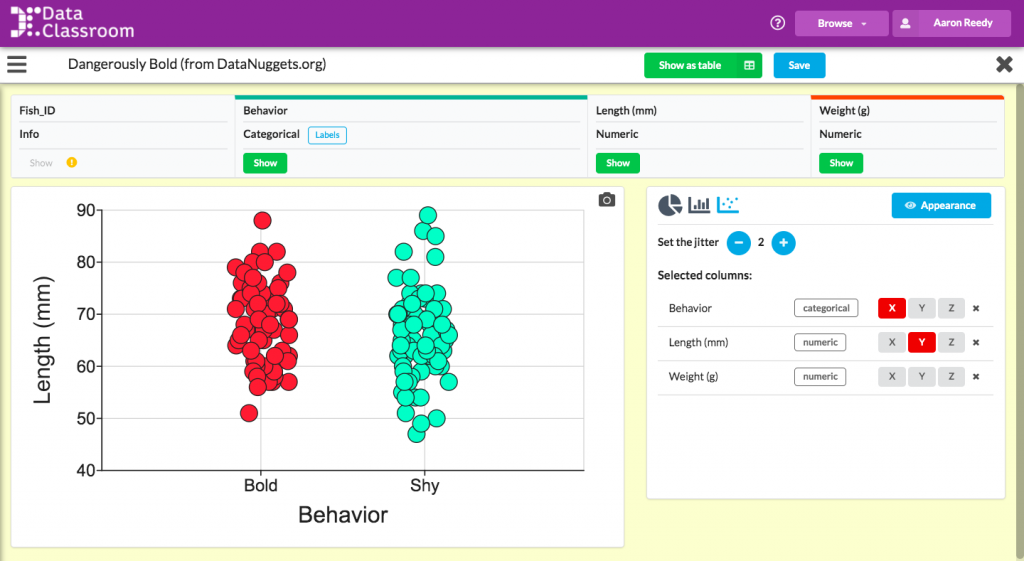
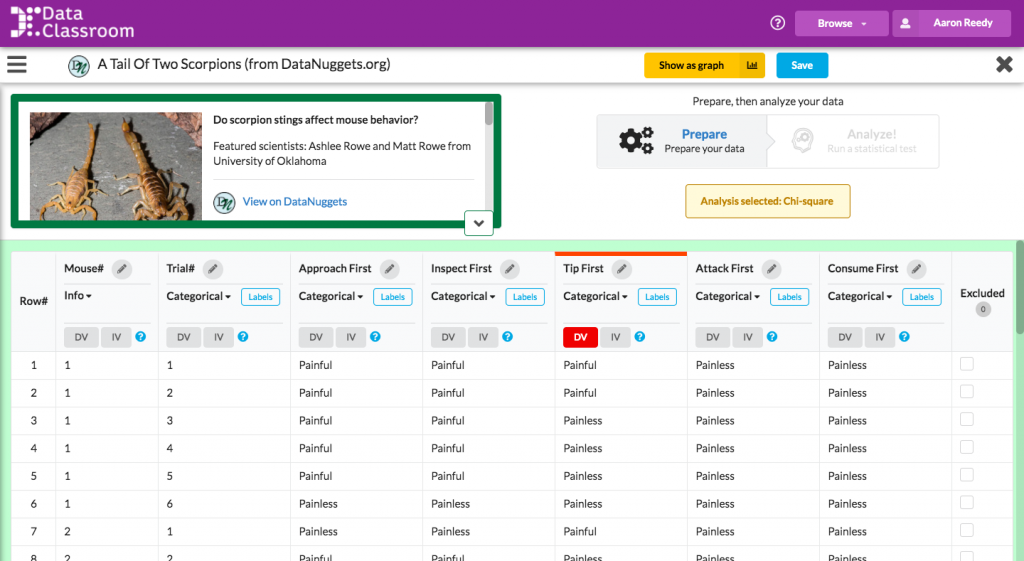
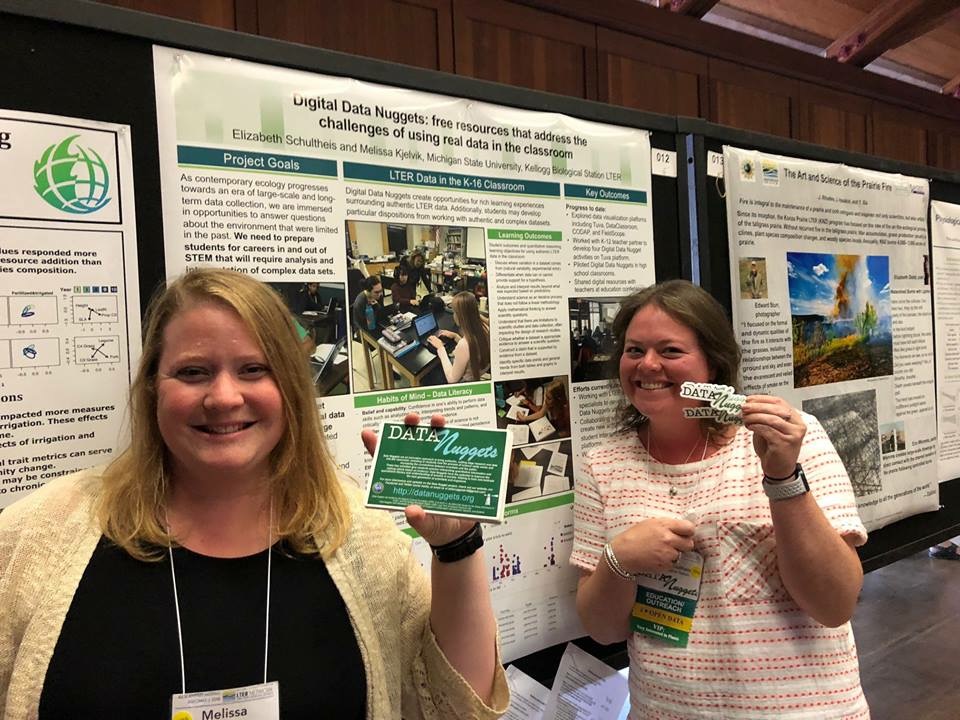
Data Nuggets, a project that has created free STEM classroom activities since 2011, is integral to the new study. Data Nuggets was founded by postdoctoral researchers Elizabeth Schultheis and Melissa Kjelvik, both of whom conducted doctoral research at the W.K. Kellogg Biological Station. The Data Nuggets activities were co-developed through collaborations between scientists and K-16 educators.
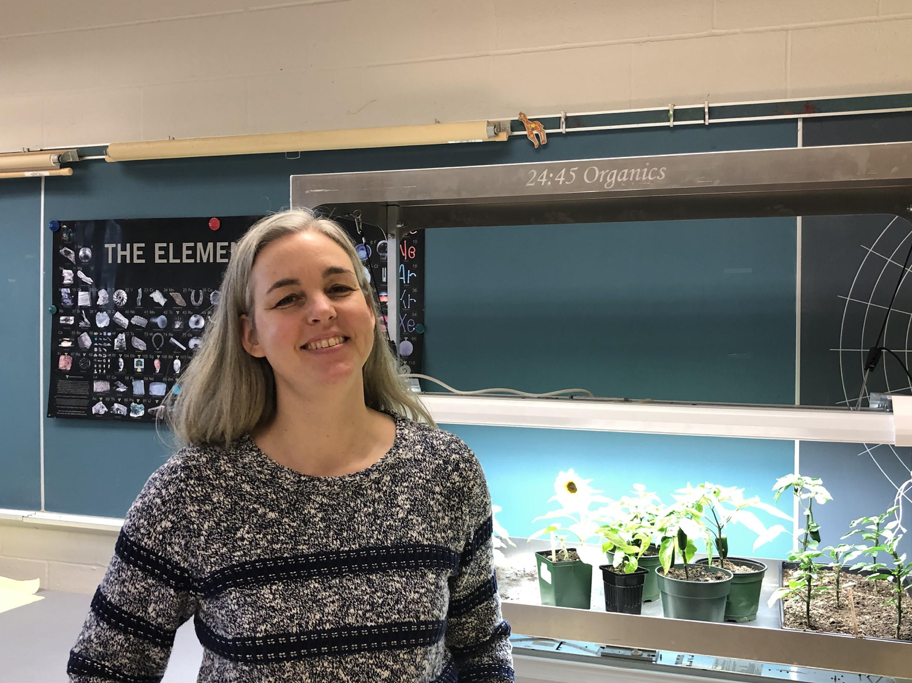
MSU ecologist Marjorie Weber will lead the study. Other members of the research team include Schultheis and Kjelvik, and Cissy Ballen and Ash Zemenick of Auburn University.