In Part I you determined that the Kauai flatwing mutation led to a decrease in parasitism rates for male crickets. Today, most of the male crickets on Kauai have evolved flat wings and can no longer produce songs that were previously used to attract female crickets. Without their songs, how do males attract females?

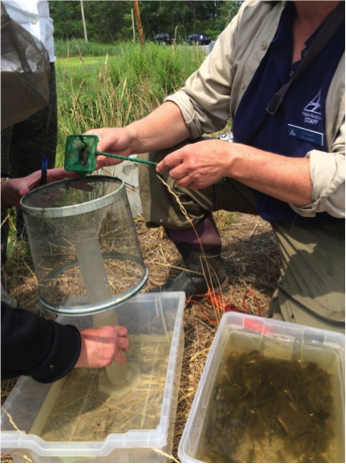
Robin collecting data on satellite behavior in normal and flatwing mutation males.
The activities are as follows:
- Teacher Guide
- Student activity, Graph Type A, Level 3
- Student activity, Graph Type B, Level 3
- Student activity, Graph Type C, Level 3
- Scientist Profile on Project Biodiversify
- Grading Rubric
- Digital Data Nugget on DataClassroom
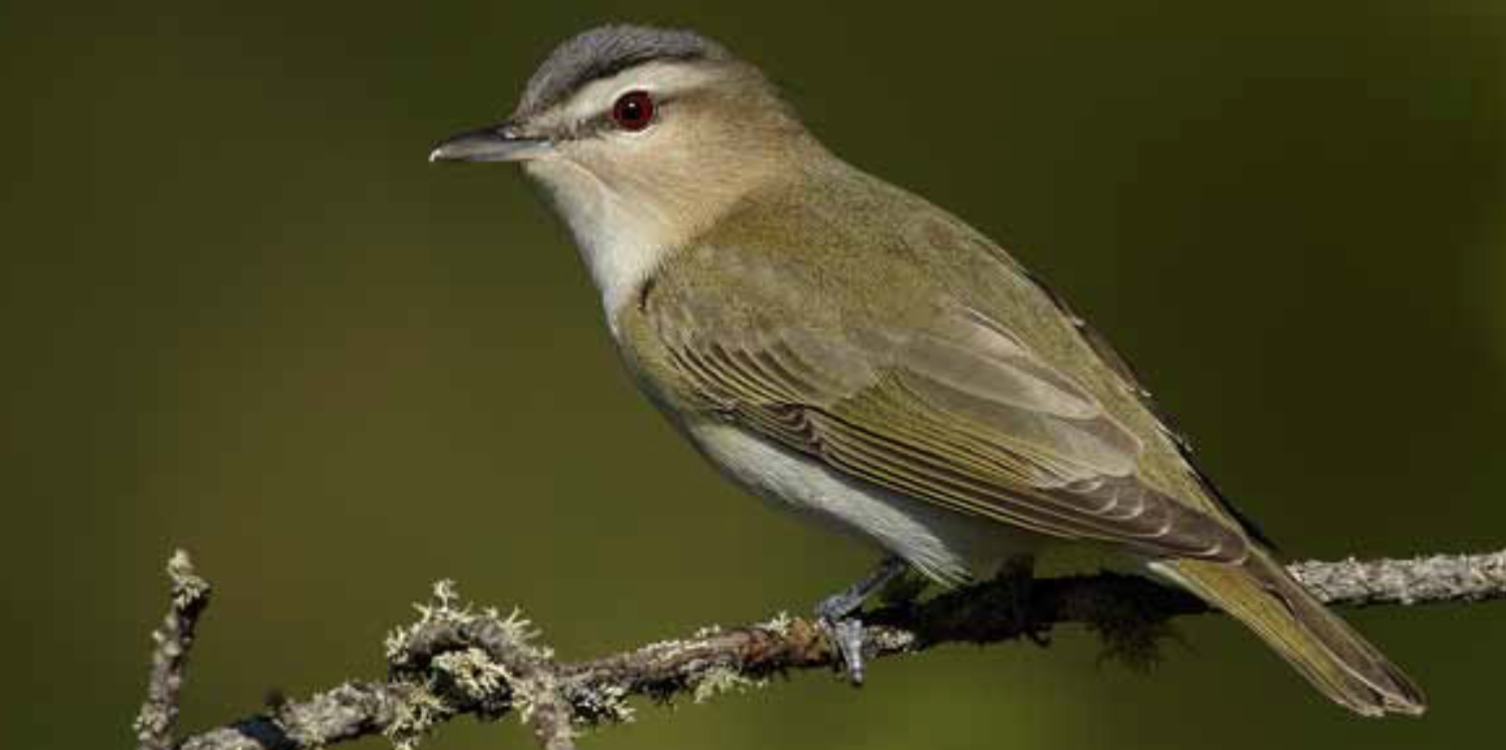
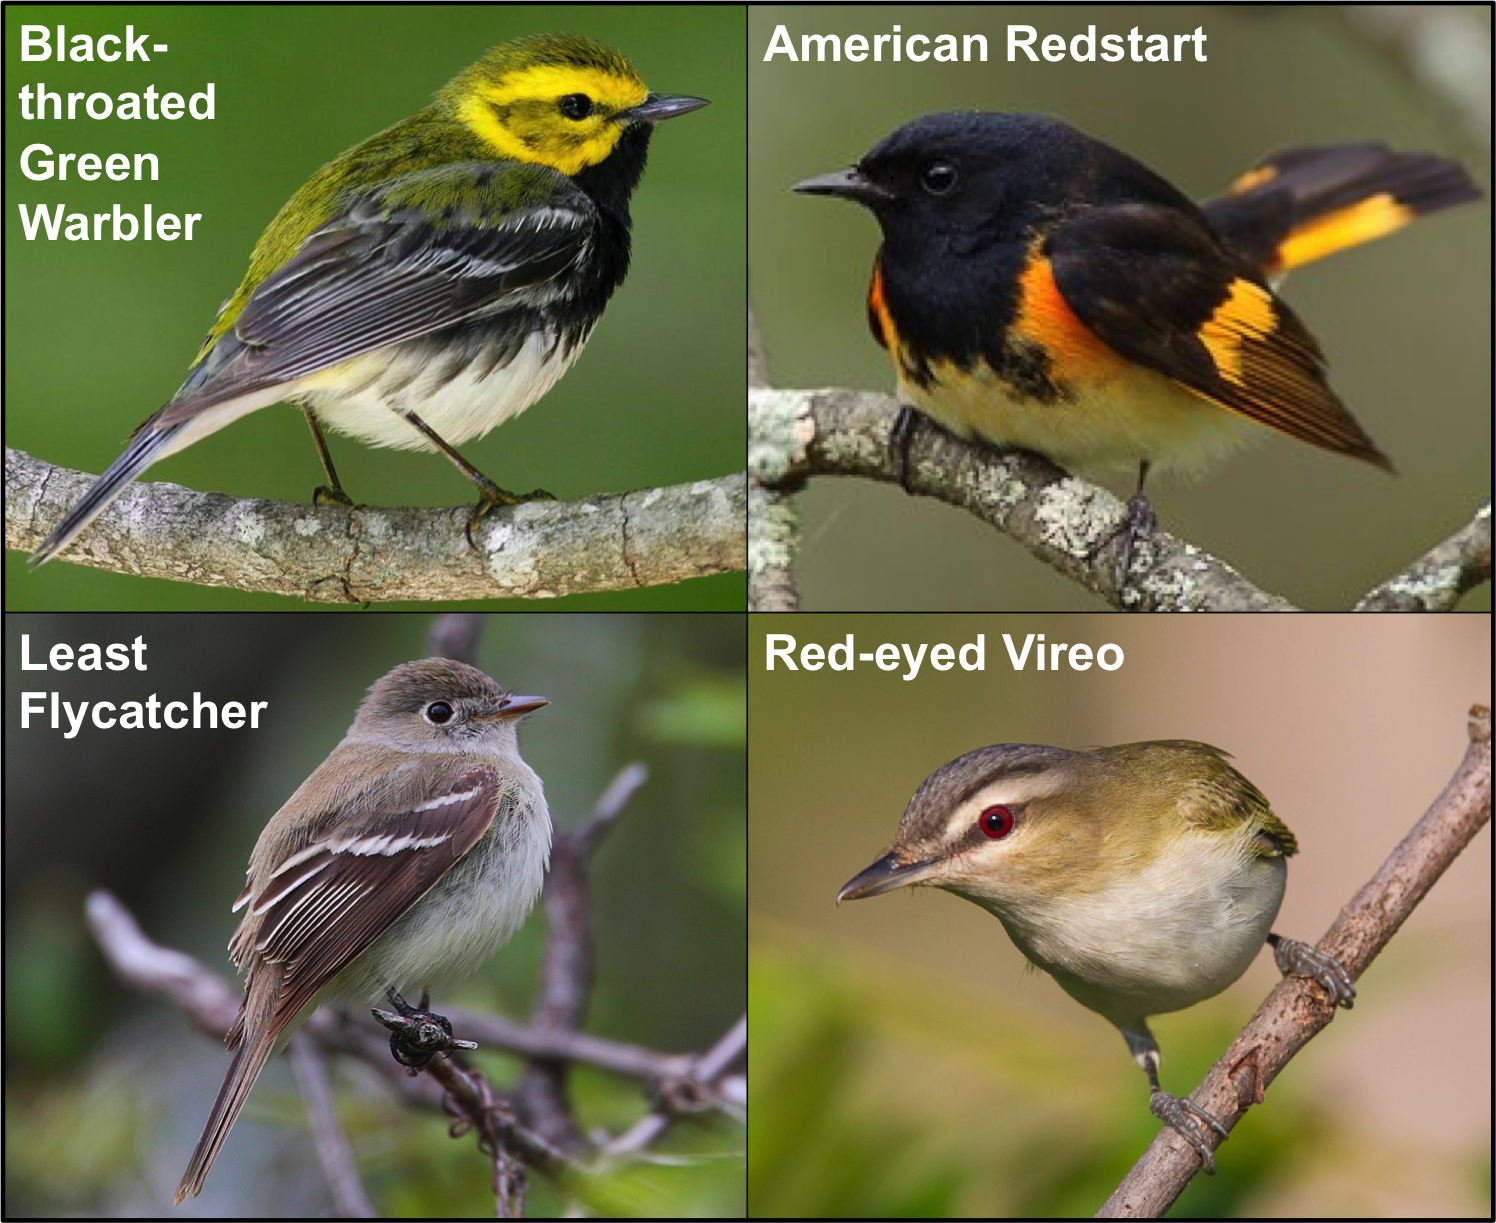
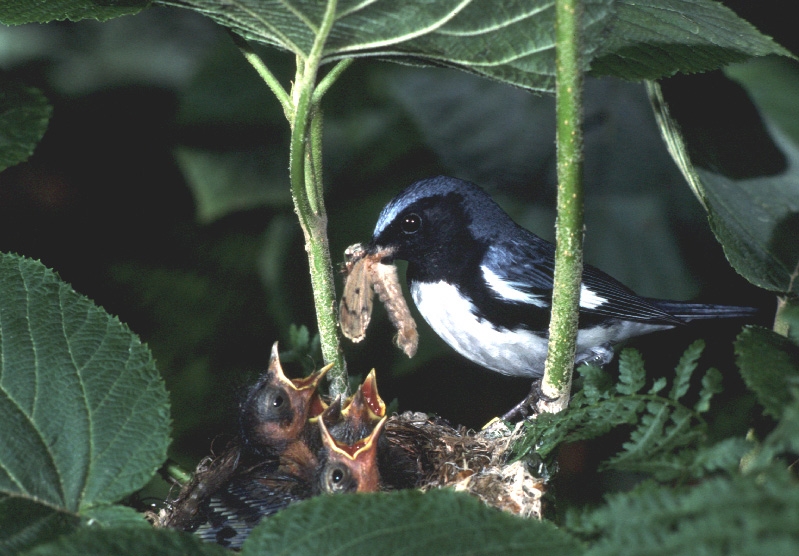
Without their song, how are flatwing crickets able to attract females? In some other animal species, like birds, males use an alternative to singing, called satellite behavior. Satellite males hang out near a singing male and attempt to mate with females who have been attracted by the song. This helps satellite males in two ways: they don’t use energy to make a song, and they avoid attracting enemies like the fly. Perhaps the satellite behavior gives flatwing males the opportunity to mate with females who were attracted to the few singing males left on Kauai.

Collecting crickets at the speaker.
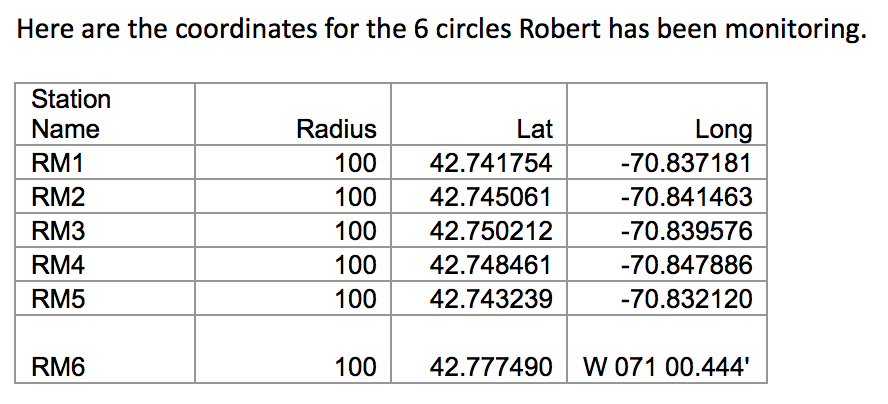
To test this idea, Robin set up a speaker playing cricket songs in the fields where the crickets live on Kauai, Oahu, and the Island of Hawaii. The speaker tricks male and female crickets into thinking there is a male cricket in the area making songs. Before the start of the experiment, Robin removed all the males found within a 2-meter circle around the speaker. She then broadcast cricket songs from the speaker for 20 minutes. She returned and counted the number of males in the 2-meter circle, measured the distance from male to the speaker, and noted whether each male was normal or flatwing. Robin expected that flatwing males would be more likely to use satellite behavior and, therefore, would be on average closer to the speaker than normal males.
Featured scientist: Robin Tinghitella from the University of Denver
Flesch–Kincaid Reading Grade Level = 10.0
Additional teacher resources related to this Data Nugget include:
- A video introducing the study system and describing how, in fewer than 20 generations, crickets on the island of Kuai went from singing to silent!
- Listen to cricket songs!
- Several papers have been published on this data and study system:
- Zuk, M., Rotenberry, J.T. & Tinghitella, R.M. 2006. Silent Night: Adaptive disappearance of a sexual signal in a parasitized population of field crickets. Biology Letters 2:521-524.
- Tinghitella, R.M. & Zuk, M. 2009. Asymmetric mating preferences accommodated the rapid evolutionary loss of a sexual signal. Evolution 63:2087-2098.
- Some popular science writings on this research:
- UC Berkeley’s Understanding Evolution Website: Quick evolution leads to quiet crickets.
- Science News: Crickets on Mute: Hush falls as killer fly stalks singers. Volume 170 (13).
- A blog post by Robin on her research.