Data Nuggets: Inspired by teachers, created using authentic research data

This post is by Data Nugget researchers Liz Schultheis and Melissa Kjelvik. See the original article on the MSTA Newsletter website (reproduced below):

Back when we were biology graduate students, we were first exposed to science education through the GK-12 program at the Kellogg Biological Station. We were each assigned a partner teacher who would mentor us as we taught lessons and shared our research with students for the first time. The experience of standing up in front of 30 middle school students was definitely intimidating! Initially we struggled to simplify and explain our research, while also making it engaging for an audience who may never have thought about these ideas before. However we quickly improved as the teachers stood in the back of the classroom and waved their arms when students checked out because we’d used too much jargon or started to nerd-out. They pushed us to describe why the things we were doing day-to-day mattered for the big picture. The teachers’ infectious enthusiasm boosted the passion we had for our research. Working with these teachers and their students quickly became our favorite time of the week.

These same teachers shared that their students were struggling when faced with data from classroom inquiry projects that turned out messy or did not follow predictions. Typically, students are only exposed to research and data published in textbooks, leading to the misconception that all science is a completed product with well established ideas and clear results. As graduate students we had access to tons of messy data from our own dissertations, and we felt by sharing our research stories we might be able to help students realize that when doing “real science” things are bound to be unexpected and unclear. Over time, we developed Data Nuggets from these ideas. Data Nuggets are classroom activities that bring students through the entire process of science, sharing the story of the scientist behind the data and an authentic dataset from their work. Students are challenged to graph and interpret the data, determining whether the data supports the scientist’s hypothesis or what future research would be necessary to fully answer their questions. Data Nuggets are also a way for us to share what we learned as GK-12 fellows with other scientists, as we guide them through the process of creating a Data Nugget of their own.

This past summer we were lucky to work with some of these same teachers again. As a group we read through student responses to Data Nuggets. This was a powerful way to identify areas we could improve to encourage deep student thinking and rich classroom discussions. While reading student responses, the teachers collectively noticed that students had a difficult time using evidence to support their claims, so they developed a tool to scaffold students into this process. To learn more about Data Nuggets and the tool they developed, make sure to come to our MSTA workshop Data Nuggets: Scaffolding claim-evidence-reasoning using real data in context.

As we continue to develop Data Nuggets, we are exploring the challenges and opportunities created when using real data in the classroom. Today we have 54 Data Nuggets (and counting) on our website, freely available and used by thousands of teachers and students. We are currently funded on a National Science Foundation Discovery Research pre-K-12 grant. The main objective of the collaborative grant, between MSU and Biological Science Curriculum Study (BSCS), is to assess whether Data Nuggets increase students’ quantitative reasoning abilities, along with their understanding of, and engagement with, science.

NABT 2016 – BEACON Evolution Symposium

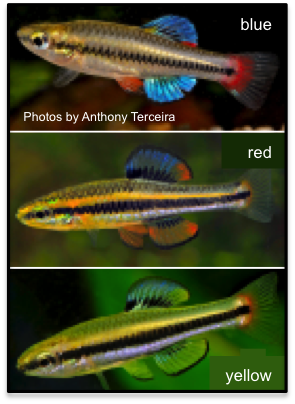
The color polymorphism in bluefin killifish – males display anal fins in blue, red, or yellow.

Why so blue? The determinants of color pattern in killifish

For more information on the NABT 2016 conference, check out their website, here.

Why be blue in a swamp? The evolution of color patterns and color vision in killifish

Animal communication happens when one organism emits a signal, which then travels through the environment and is detected by the sensory system of another. The environment in which signaling occurs can dramatically alter signal transmission and result in selection where different signals are favored in different environments. The bluefin killifish provide a compelling example. Some populations are found in crystal clear springs (where UV and blue light are highly abundant) and others are found in tannin-stained swamps (where UV/blue light is depauperate). Paradoxically, males with blue color patterns are abundant in swamps and are rare in springs. The resolution to this paradox requires a consideration of how genetics and the environment influence trait expression, as well as the direction of natural and sexual selection in different habitat types, and the manner in which animals with different visual systems perceive the same color pattern.

Data Nugget Workshop: Why so blue? The determinants of color pattern in killifish

Data Nuggets are hands-on activities designed to improve the scientific and quantitative skills of students by having them graph and interpret scientific data gathered by practicing scientists. This workshop will provide an overview of Data Nuggets and present a Data Nugget featuring data on the genetic and environmental basis of color pattern expression in killifish. This Data Nugget will allow students to determine whether color pattern expression is due to ‘nature’ (e.g., genetics), ‘nurture’ (e.g. environment), or the interaction of the two.

beaconThe materials from the Data Nugget workshop are as follows:

Workshop organized and presented by: Becky Fuller, Elizabeth Schultheis, Melissa Kjelvik, Alexa Warwick, and Louise Mead

BEACON CENTER FOR THE STUDY OF EVOLUTION IN ACTION, MICHIGAN STATE UNIVERSITY & UNIVERSITY OF ILLINOIS

Lobsters out of water: Scientists at film camp in Maine

beacon_header

This post is by MSU graduate student Carina Baskett. See the original article on the BEACON webpage (reproduced below):

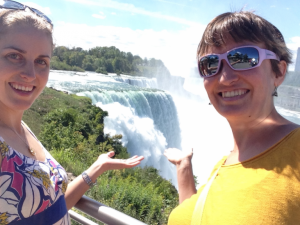
Carina and her fellow science communicator Klara Scharnagl making a stop at Niagara Falls on the way back from a film workshop in Maine.

Carina and her fellow science communicator Klara Scharnagl making a stop at Niagara Falls on the way back from a film workshop in Maine.

My colleague Klara Scharnagl had a great idea. “Let’s shoot it from the perspective of a vegetable!” As a scientist, I don’t usually go to work expecting to hear a sentence like that! But yes, we did end up shooting a short video at a farmer’s market from the perspective of a love-struck melon, all in the name of science education.

Klara and I were at a weeklong film workshop in Maine the first week of September to improve our filmmaking skills. We are working on a BEACON-funded project with Melissa Kjelvik, Liz Schultheis, Travis Hagey, and Anna Groves to make videos for classrooms about scientists. The videos will accompany Data Nuggets (DNs), which are exercises for K-12 and undergraduate students to practice working with data from real, current research. DNs were co-developed by MSU graduate students and K-12 teachers.

The goals of the videos are two-fold. First, we aim to redefine how students see science and scientists by featuring researchers from diverse backgrounds, giving students more face time with the scientists than they can get from a photo in a DN. Second, we aim to enhance evolution education by showing how data is collected and presenting information in an alternative media to the standard written descriptions.

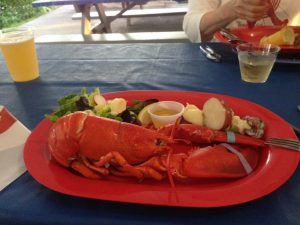
A Maine lobster dinner was the cherry on top of the film workshop sundae!

A Maine lobster dinner was the cherry on top of the film workshop sundae!

On top of those goals, there is the overriding need for the videos to be engaging, and the first, somewhat invisible step toward that goal is to be technically proficient. Klara and I each have experience with science outreach and a smattering of the requisite technical skills for filmmaking, but we needed more training and experience with videos. So we found a workshop, “Documentary Camera” at a school called Maine Media.

Klara and I were the only scientists out of the 11 students in the class. In fact, some of the students said that we were the only scientists they had ever met. Being in a classroom where I was clueless and surrounded by people more expert than me was a lot like being a first-year graduate student again! But it was fun to learn so much.

To practice the techniques that we would be using for the DN videos, Klara and I made a “pilot.” We decided that it had to be about plants or lichens (the organisms that we study), not humans or animals, because a major challenge of the DN videos will be to tell engaging stories about organisms and questions that aren’t inherently exciting to most of the population. Personally, I find plants and lichens to be a lot more exciting than, say, sports, but I realize I’m in the minority with that view.

The closest we could come to interviewing a plant expert was to go to an “herbal apothecary,” a pharmacy where all the medicines and remedies come from plants. The message of the video was to get viewers excited about the chemicals that plants make, by pointing out that traditional and many modern medicines come from plants, and then slip in some biology by asking why plants make these chemicals (generally to defend themselves from pests and disease).

We visited the apothecary on short notice, and were able to snag a quick interview with a gardener. When asked, “Plants don’t make these chemicals for human use. Why do they?” she said, “How do we know they don’t make them for humans? Hmm, I’ll have to think about that.” This was an informative moment for us in a couple ways.

First, it was a good reminder that a lot of the scientific knowledge we take for granted, and even the questions that scientists think to ask, are not common sense. Even someone whose job it is to work with plants and the chemicals they manufacture was not considering the evolutionary explanation for why plants have these adaptations that we are co-opting. Yet it would be helpful for someone working with plant medicine to have an understanding that related plants might manufacture similar compounds and that the environmental context (such as an outbreak of caterpillars on a plant) might affect the drugs that they are harvesting. That’s why evolution education and outreach are so important!

Second, the interview was good practice for the DN videos because we aren’t always going to get a nice, video-ready sound bite from everyone we talk to. Some of the scientists we interview might use too much jargon and be unable to make their research approachable. But that’s why we will include narration and drawings to guide the narrative. We ended up using the gardener’s quote about why she thinks plants are amazing and exciting, and we provided the explanation of why plants make chemicals that we use for medicine.

So was our science communication effective? On the last day of the workshop, participants from several classes ate an amazing dinner of Maine lobster, and then watched each other’s projects. It was funny to see our educational video mixed in with a beautifully shot piece showing a nearby harbor as the catch was being brought in; with a portrait of a pair of local artists whose house is covered in drawings; and with some dramatic fictional pieces from another class. When I asked everyone afterward, “So why do plants make chemicals that we use for medicine?” almost all of them answered correctly. If we can reach a group of filmmakers who didn’t even know there would be a quiz, hopefully we can have an impact on students, by helping to make Data Nuggets just a little more delicious.

You can watch our 5-minute video below! And if you have an extra few minutes and wouldn’t mind giving us some feedback, please click here.

Collaborations with K-12 teachers first inspired Data Nuggets, and continue to today

beacon_header

This post is by MSU postdocs Liz Schultheis and Melissa Kjelvik. See the original article on the BEACON webpage (reproduced below):

Liz modeling the process of science within a Data Nugget.

Liz modeling the process of science within a Data Nugget.

Back when we were biology graduate students, the GK-12 program at the Kellogg Biological Station (KBS) exposed us to science education for the first time. When we signed up to work with K-12 teachers and go into schools as the “classroom scientist” we knew there would be benefits, such as time to hone our science communication skills, a venue to share our research with broad audiences, and of course saving us the hour and a half drive to MSU’s main campus to TA. However, we had no idea what we had really gotten ourselves into.

We were each assigned a partner teacher whose classroom we would visit a few times a week, and who would mentor us as we attempted to share our research with students for the first time. The experience of standing up in front of 30 sixth graders was intimidating at first. Yet, it was necessary to realize how hard it was to simplify and explain a topic, while also making it engaging for an audience who may never have thought about these ideas before. The teachers’ infectious enthusiasm boosted the passion we had for our research. They pushed us to describe why the things we were doing day-to-day mattered for the big picture. They were willing to stand in the back of the classroom and wave their arms when students checked out because we’d used too much jargon or started to nerd-out. These teachers had such a clear passion for improving student learning; they constantly stepped out of their comfort zone to try new ways to improve their teaching and integrate the latest effective science teaching strategies into their classrooms. Working with these teachers and their students quickly became our favorite time of the week.

These same teachers originally inspired Data Nuggets; they shared that their students were struggling to make sense of data in most applications, but especially data from classroom inquiry projects that turned out messy or did not follow predictions. Students should not feel they have failed when their data has variation around the mean or does not support their hypothesis. Typically, students are only exposed to research and data published in textbooks, leading to the misconception that all science is a completed product with well established ideas and clear results. To get students to think like scientists, they need to be exposed to the process of science itself and how scientists work to develop, test, and refine their ideas. As early-career scientists, we knew that along the way, experiments often fail or yield unexpected results.

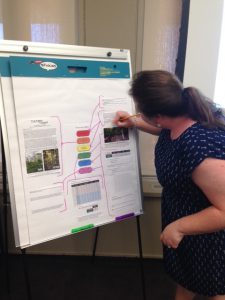
Melissa running a professional development workshop for high school math and science teachers.

Melissa running a professional development workshop for high school math and science teachers.

For continued support, we turned to BEACON, whose education objectives align with the Data Nuggets vision. Using these seed funds, we were able to work with Louise Mead and other BEACON scientists to develop Data Nuggets that connect students to real data and the motivation and passion of the scientists behind the research. Today we have 46 Data Nuggets (and counting) up on our website, freely available to teachers and students, many written by women and early career scientists.

As we wrapped up as graduate students, we realized there was so much more we wanted to do to improve and expand Data Nuggets. The support from BEACON allowed us time to fully develop our ideas and submit an NSF DRK-12 grant with Louise. As BEACON postdocs we are excited to have time to integrate all these great ideas into Data Nuggets. The main objective of the collaborative NSF DRK-12 grant, between MSU and Biological Science Curriculum Study (BSCS), is to assess whether Data Nuggets increase students’ quantitative reasoning abilities, along with their understanding of, and engagement with, science. In preparation for this efficacy study, we are currently revising each Data Nugget and integrating new ideas and feedback from our collaboration.

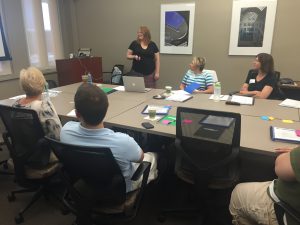
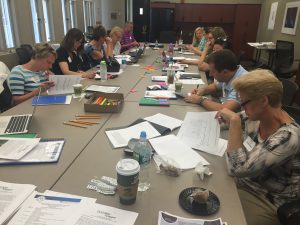
High school math and science teachers working to complete a Data Nugget during a professional development workshop.

High school math and science teachers working to complete a Data Nugget during a professional development workshop.

This summer we worked with 4 teachers – Marcia Angle, Cheryl Hach, Ellie Hodges, and Kristy Campbell. Marcia and Cheryl have been with us since the beginning, and were among those who first helped us develop Data Nuggets. They were thrilled to see that we continued to develop Data Nuggets and were happy with how far they’d come since the original inception. This summer we had many insightful conversations about students’ struggles with certain scientific practices, including data interpretation and constructing explanations. The teachers shared their different teaching strategies, and researched new ones, in order to write guides to help other teachers cover these difficult topics. As a group we read through student responses to Data Nuggets piloted in the spring. This was a powerful way to think deeply about the areas students could improve, and ways for us to provide more context in our teacher guides to encourage rich classroom discussions. Along with BEACON postdoc Alexa Warwick, the teachers developed a grading rubric to help teachers score Data Nuggets and identify areas where their students need more practice. While reading student responses, the teachers collectively noticed that students had a difficult time using evidence to support their claims, so they worked on a new tool to ease students into this process. They presented this tool, along with other strategies, at professional development workshops for the KBS K-12 partnership teachers and all Kalamazoo Public Schools high school science teachers.

This year we are finalizing preparations for our Data Nugget efficacy study, taking place in 2017. Preliminary observations in classrooms, and feedback from teachers, indicate Data Nuggets effectively increase students’ quantitative and scientific literacy while engaging them with the story behind the research and building a connection to scientists. However, as scientists, we are of course not satisfied with anecdotal evidence and want data to support our claims! We are excited for the upcoming study to determine the ways in which Data Nuggets might contribute to a strong science education curriculum!

Professional Development Workshop @ KBS Summer Institute 8/18/16

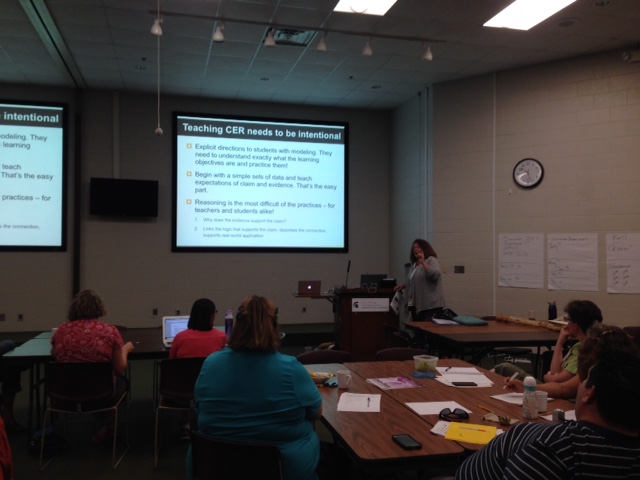
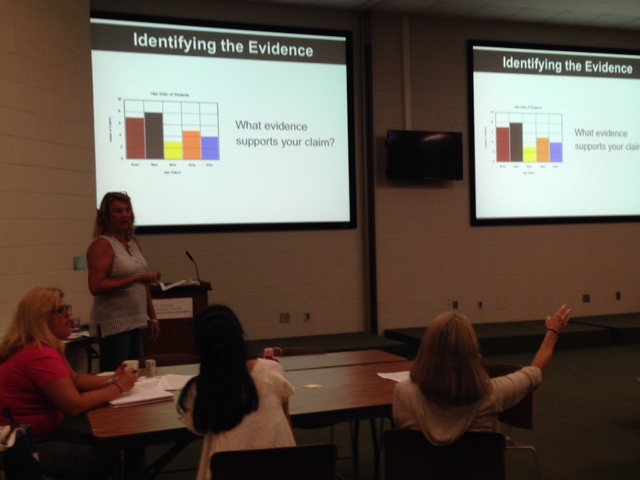
Advice on how to use the Claims-Evidence-Reasoning framework in your classroom intentionally. Session presented with two Michigan science teachers, Marcia Angle and Cheryl Hach.

Session Description: In our session we will talk about the transition of science education away from memorization of facts and more towards the application of applying critical thinking and quantitative reasoning. We will discuss the importance of scaffolding student learning centered on the scientific principles of investigation, student discourse, and will unveil our new graphic CER organizer that we designed to support student writing when it comes to Claim, Evidence and the oh so difficult Reasoning portions of science writing. We use Data Nuggets throughout the session to model how you can integrate our CER tool into the classroom and increase the amount of data analysis and interpretation done in your classroom. This session is for upper elementary, middle and high school teachers whose students struggle with quantitative skills and CER writing. Our little nuggets can do great things!

IMG_4586

IMG_4588

CqKUuMDWgAE1oJY.jpg-large

CqJl8dkXYAU63nH.jpg-large

Professional Development Workshop with NY Master Teachers 8/8/16

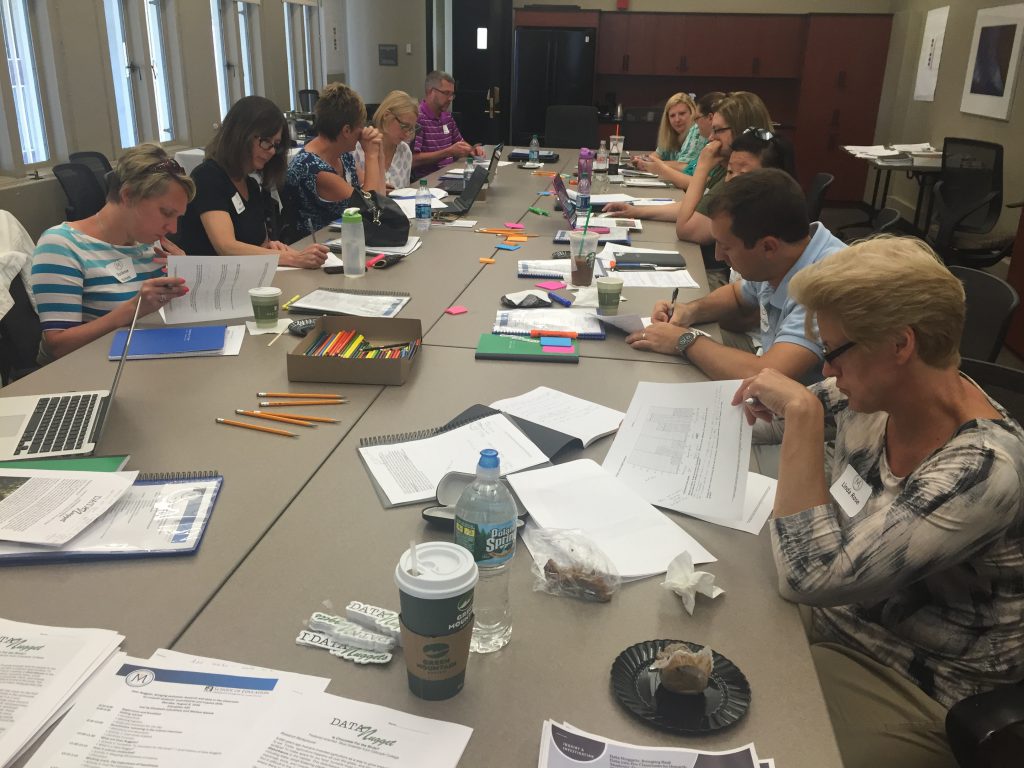
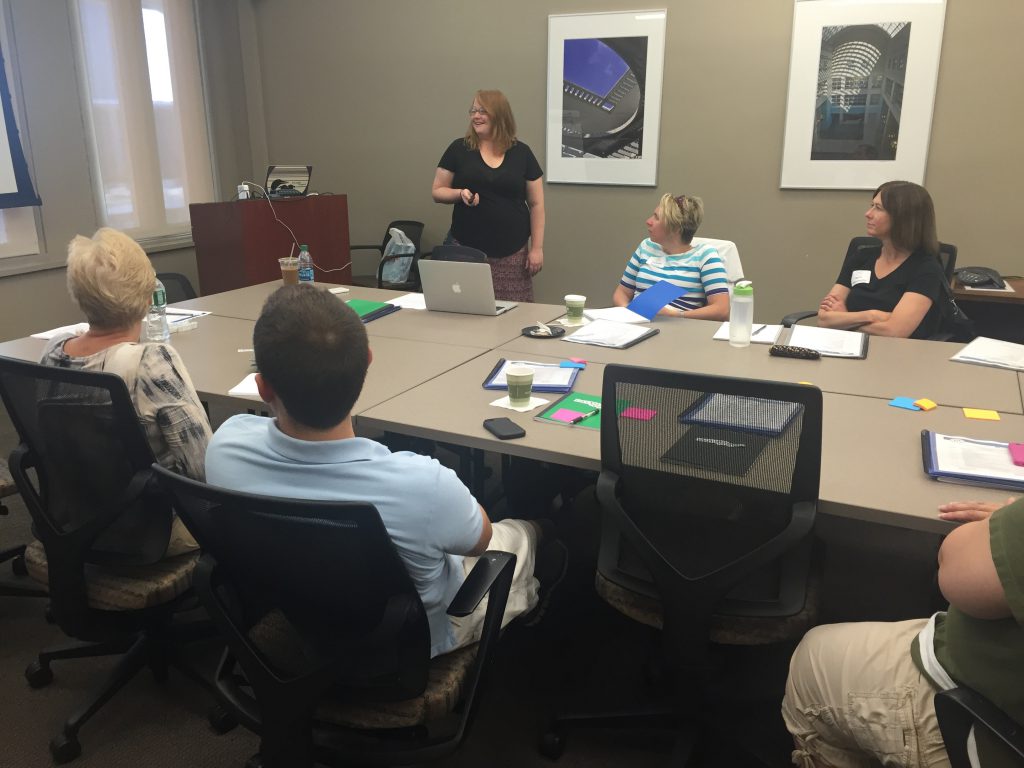
Workshop Description: In this workshop we demonstrated how to use our current Data Nugget resources in the classroom. We took an in depth look at the big themes present in these activities, including distinguishing hypotheses from predictions, using claim-evidence-reasoning structure to help students construct explanations, and modeling the process of science followed in real research. Finally, we shared our exciting plans for testing the efficacy of Data Nuggets at increasing student quantitative literacy, understanding of science, and motivation to pursue careers in science.

IMG_6556

IMG_6555

Participants: Judy Selig, Matthew Schuchman, Paula Fernes, AnneMarie Giles, Lisa Brosnick, Trevor Tripp, Eun Mi Heo, Annie Chien, Linda Rose, Karin Marcotullio, Darlene Nichols, Michelle Van Steele, and Amanda Huszar.

Data Nuggets at the National Academies Special Topics Summer Institute on Quantitative Biology

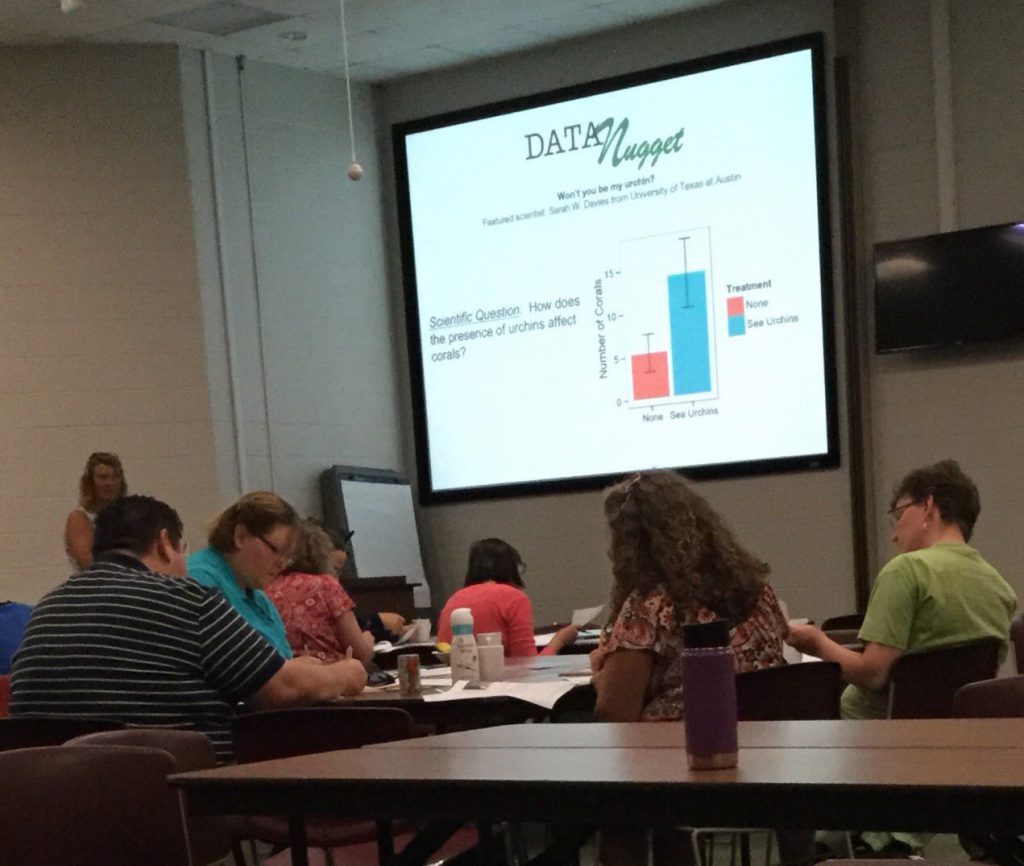
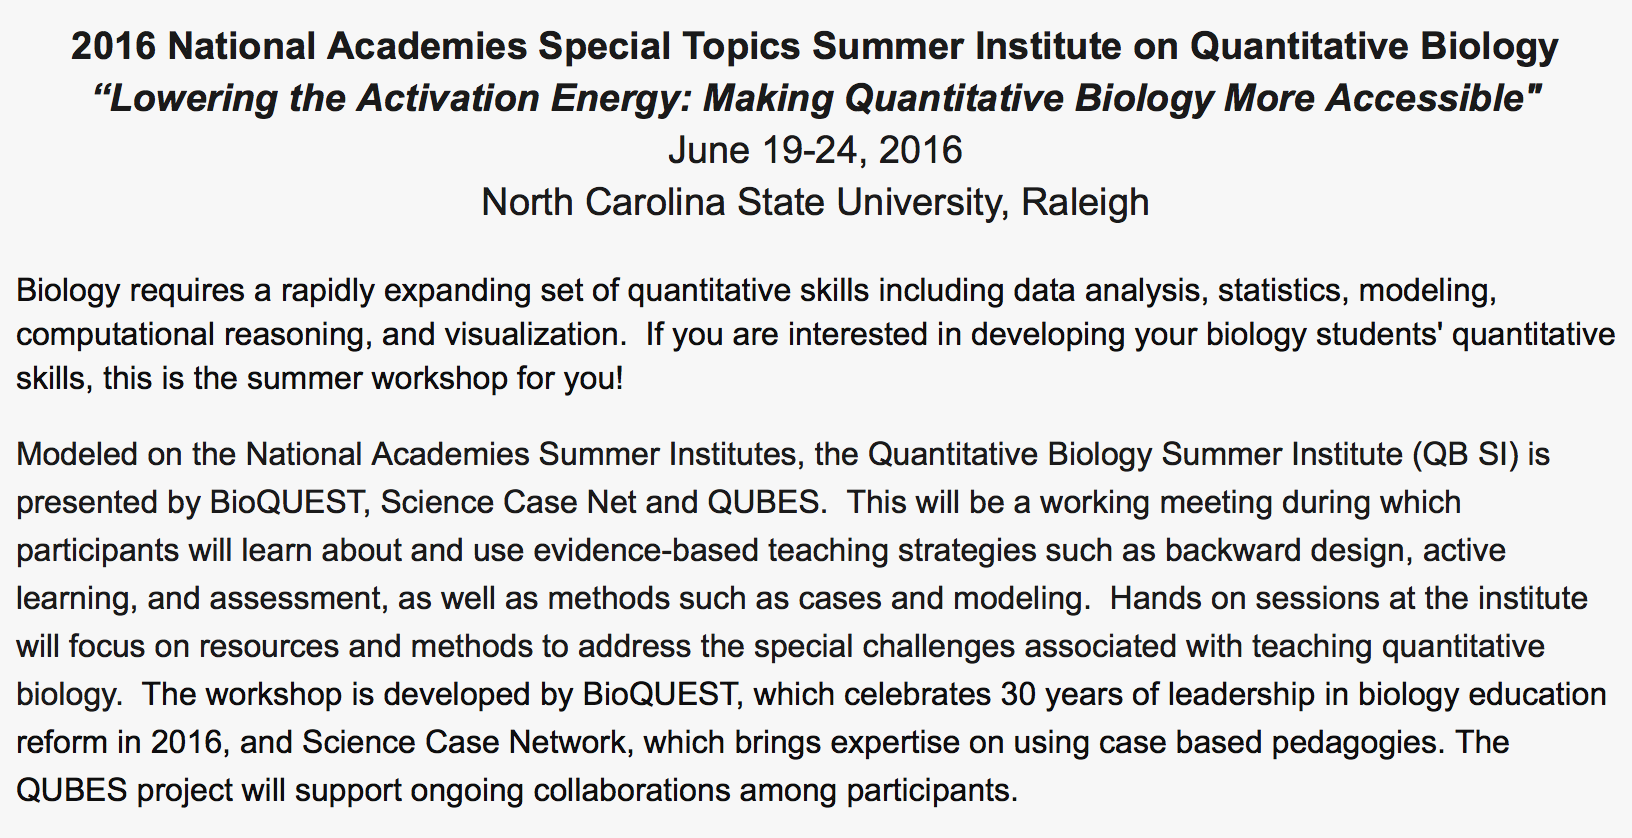
Data Nuggets will be presented at the National Academies Special Topics Summer Institute on Quantitative Biology on June 20th.

To see the event on Facebook, click here.

Screen Shot 2016-05-17 at 10.37.09 AM

The Data Nugget “9 piece” team – developing new activities to bring real data into undergraduate classrooms! From left to right: Melissa Kjelvik, Jodi Forrester, Elizabeth Schultheis, Vedham Karpakakunjaram, Michelle Fisher, and Aditi Pai (not pictured: Kristine Grayson, Jim Smith, Bob Mayes)IMG_6280All the participants at the QUBES/BioQuest working group!
IMG_20160624_100900

LTER Data Nuggets: Breathing new life into long-term data

The original blog post can be found on the KBS LTER website here.

LTERHEADER

Each year the KBS LTER program awards graduate students summer fellowships. Here Elizabeth Schultheis and Melissa Kjevik, now both postdoctoral researchers with Michigan State University, describe the project their summer fellowship supported.

Today it is apparent that students and the public continue to struggle when faced with data and its interpretation. When asked to make sense of data taught in their science classrooms, gathered during classroom inquiry projects, or found in the news, students are unable to connect quantitative information to explanations of the way the world works. Without exposure and practice, a large dataset or complicated graph can seem insurmountable. In collaboration with K-12 teachers, the Kellogg Biological Station (KBS) GK-12 programBEACON, and the LTER, we created Data Nuggets to help students overcome roadblocks when working with and interpreting data.

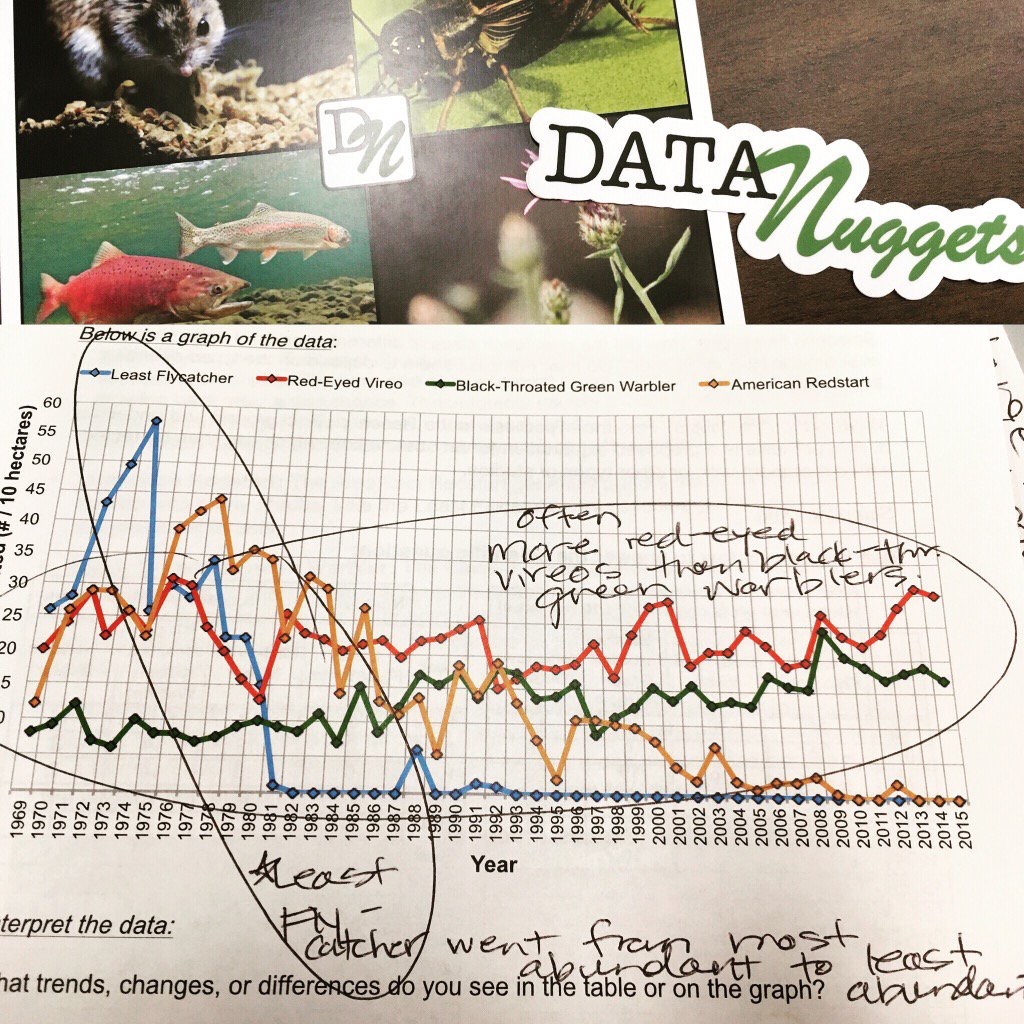
Data Nuggets are targeted classroom activities focused on developing quantitative skills for K-16 students. They are created from recent and ongoing research, bringing cutting edge science into the classroom and helping scientists share their work with broad audiences. The standard format of each Data Nugget provides background information about a scientist and their research, along with how they became interested in their research questions and system that they study. Each Data Nugget includes a real dataset for students to graph, interpret, and use to construct an explanation.

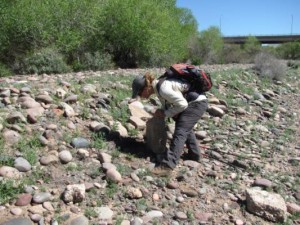
Scientist Mélanie Banville searching for reptiles in the Central Arizona-Phoenix LTER. Her and Heather Bateman’s Data Nugget, “Lizards, Iguanas, and Snakes! Oh My!”

Scientist Mélanie Banville searching for reptiles in the Central Arizona-Phoenix LTER. Her and Heather Bateman’s Data Nugget, “Lizards, Iguanas, and Snakes! Oh My!”

LTER Data Nuggets

The collaboration between Data Nuggets and the LTER is a mutually beneficial fit. LTER scientists help strengthen the Data Nuggets project by increasing the diversity of data and research available to students. In turn, Data Nuggets provide an avenue for LTER scientists to share their work and findings with a broad audience of students, teachers, and fellow scientists. Sharing research findings with the non-science public is an important part of the science process, yet is often one of the most challenging to achieve. With broader impacts a factor in most grants, finding effective methods of communication and transmission is key. Researchers who create Data Nuggets must dig deep to uncover the core messages of their research and think back to the big question that got them passionate about the research in the first place. Also, by creating a Data Nugget and practicing communicating research to a 6th grader, scientists can rest assured that at their next conference they’ll be better able to discuss their work with collaborators and those outside their field!

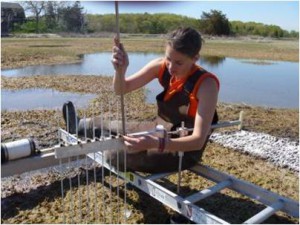
Researcher Sam Bond taking Sediment Elevation Table measurements in Plum Island Ecosystems Long Term Ecological Research site. For more information on this research, check out Anne Giblin’s Data Nugget, “Keeping Up With the Sea Level”.

Researcher Sam Bond taking Sediment Elevation Table measurements in Plum Island Ecosystems Long Term Ecological Research site. For more information on this research, check out Anne Giblin’s Data Nugget, “Keeping Up With the Sea Level”.

Most importantly, a great outcome of using LTER data to create Data Nuggets is that teachers and students will directly benefit from additional resources that highlight the importance of data and science in an authentic context. Activities aiming to improve quantitative skills are more effective if they’re grounded in real world situations that students can relate to. Connecting science to a student’s experiences and local ecosystems makes the content more accessible, particularly for culturally and linguistically diverse students. These connections also allow students to envision a place for themselves in science. To assist with place-based learning, each Data Nugget is categorized and searchable by the location where the study occurred, allowing teachers to connect data to their students’ environment. In this way, LTER Data Nuggets have the potential to increase interest and engagement with science and data, in both students and the public.

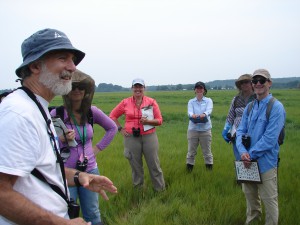
Robert Buchsbaum, from Mass Audubon, preparing his team for a morning of salt marsh bird surveys. Find out more about his research on the endangered Saltmarsh Sparrow in his Data Nugget, “Does Sea Level Rise Harm Saltmarsh Sparrows?”

Robert Buchsbaum, from Mass Audubon, preparing his team for a morning of salt marsh bird surveys. Find out more about his research on the endangered Saltmarsh Sparrow in his Data Nugget, “Does Sea Level Rise Harm Saltmarsh Sparrows?”

Working with LTER Scientists and Educators

This past summer (2015), we received support from the LTER Summer Fellowship program. This support allowed us to continue our work with Data Nuggets, and to strengthen their connection to the vast stores of data available through the LTER, including the KBS site and the other 24 sites in the LTER Network. While the LTER Network has conducted over three decades of amazing research, spanning diverse ecosystems and taxa, LTER education and outreach specialists are still finding creative new ways to share this important research with the public. Data Nuggets can breath new life into long-term

datasets, opening them up to the public and future scientists. These funds were used to support training workshops at the LTER All Scientists Meeting (ASM) in Estes Park, CO in August and at KBS in July. These two workshops supported early and late career scientists (graduate students, postdocs, faculty, and REUs) and many LTER education and outreach specialists looking to broaden the impact of the LTER’s research and improve their communication skills. In addition, at the LTER ASM we participated in a poster session to reach out to those who were unable to attend our workshop. Our outreach efforts strengthened the connection between Data Nuggets and the LTER, and resulted in the creation of nine (and counting!) new Data Nuggets based on LTER research. Additionally, in August, we spoke to the teachers working with the KBS K-12 Partnership, connecting them with the LTER Data Nuggets and the vast pool of LTER data, freely available online.

When reflecting back on this summer, it was so great to work with a diversity of LTER scientists across the network. We enjoyed learning new science stories and are very happy to now include coastal, urban riparian, and other ecosystems in the Data Nuggets collection. Please feel free to contact Melissa or Elizabeth if you would like more information or to get started creating your own Data Nugget! For a list of all the Data Nuggets created by LTER scientists and outreach leaders, click here!

Survey for teachers using Data Nuggets!

Screen Shot 2014-09-15 at 2.15.13 PM

You are invited to participate in this online survey about whether you are using Data Nuggets in your classroom, and if so, what students have gained from using this educational resource. The survey will take approximately 10-20 minutes to complete. This survey is anonymous and voluntary; your personal information will not be attached to your responses. At the end of the survey you will be asked about your interest in the classroom-based research study we will conduct in 2017. If you indicate that you are interested in the classroom-based study we will use your email address to provide you with more information about that study.

The findings from this survey will be used to:

  1. Inform future development of Data Nuggets
  2. Design research to test the efficacy of Data Nuggets in improving students’ scientific and quantitative literacy

Click here to begin the survey!

Please complete the survey by February 1stShould you have any questions about the study or the procedures, you may contact Molly Stuhlsatz at mstuhlsatz@bscs.org.

Data Nugget Workshop at NABT 2015: A Tail of Two Scorpions

You can get the slides from our NABT talk here: A Tail of Two Scorpions

Screen Shot 2015-11-05 at 2.53.53 PM

Screen Shot 2015-11-05 at 2.51.22 PM