On Friday, May 9th, the National Science Foundation (NSF) terminated a collaborative research grant shared between Michigan State University and Auburn University, “Sharing Scientist Role Model Stories to Improve Equity and Success in Undergraduate STEM Education”, which had over $1M in unused funds remaining. We join over 1,600 grants abruptly terminated by NSF in recent months, affecting vital research, education, and open science efforts nationally.
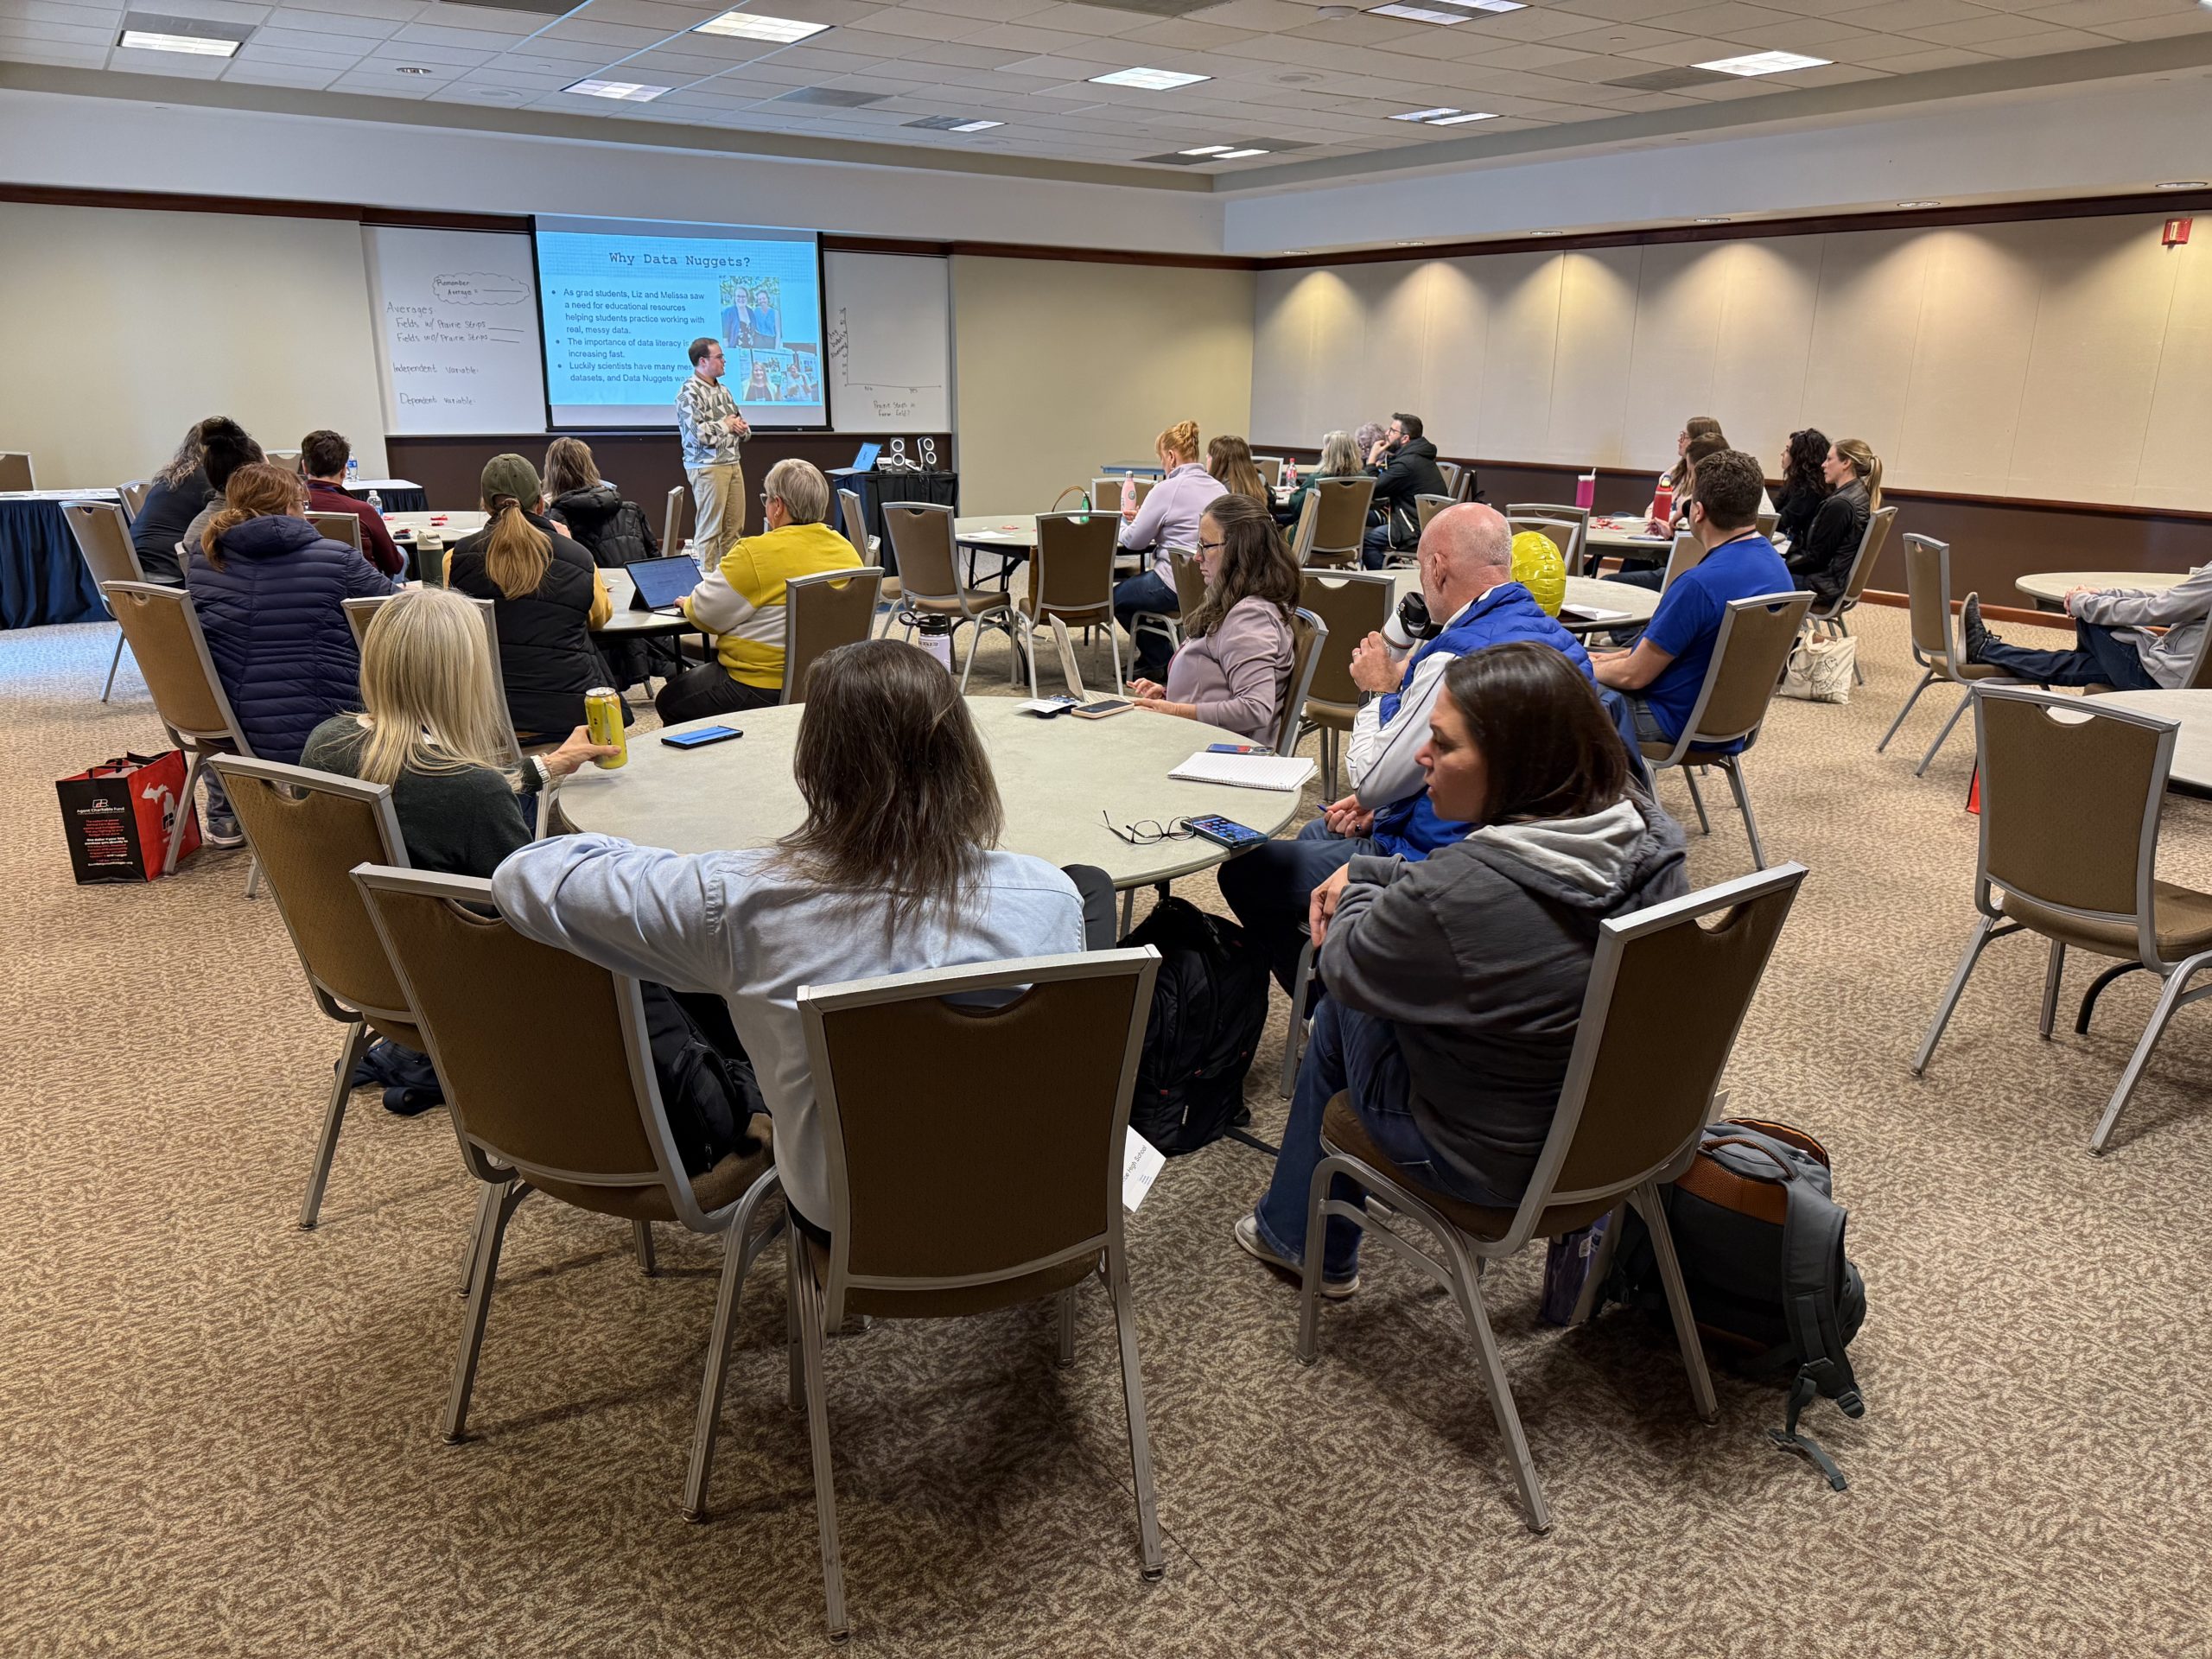
NSF has been a critical partner in fueling the Data Nuggets team’s innovations and growth at Michigan State University. In fact, NSF funded the collaboration between scientists and K-12 teachers that sparked the development of Data Nuggets in 2010. Data Nuggets provide over 140 free data literacy activities that reach tens of thousands of educators and countless students per year. Without NSF’s historic investments and continued support, our wildly popular and effective data literacy program would not exist.
By terminating our collaborative grant, financial support and personnel needed to run this program no longer exist. We are committed to maintaining the existing collection of publicly available Data Nugget resources and continue to provide them for free. However, we will need to revise our operational model in order to develop and disseminate new activities. Additionally, we will no longer be able to conduct and disseminate foundational educational research to increase our understanding of the best teaching practices for using activities featuring scientists within classroom materials.
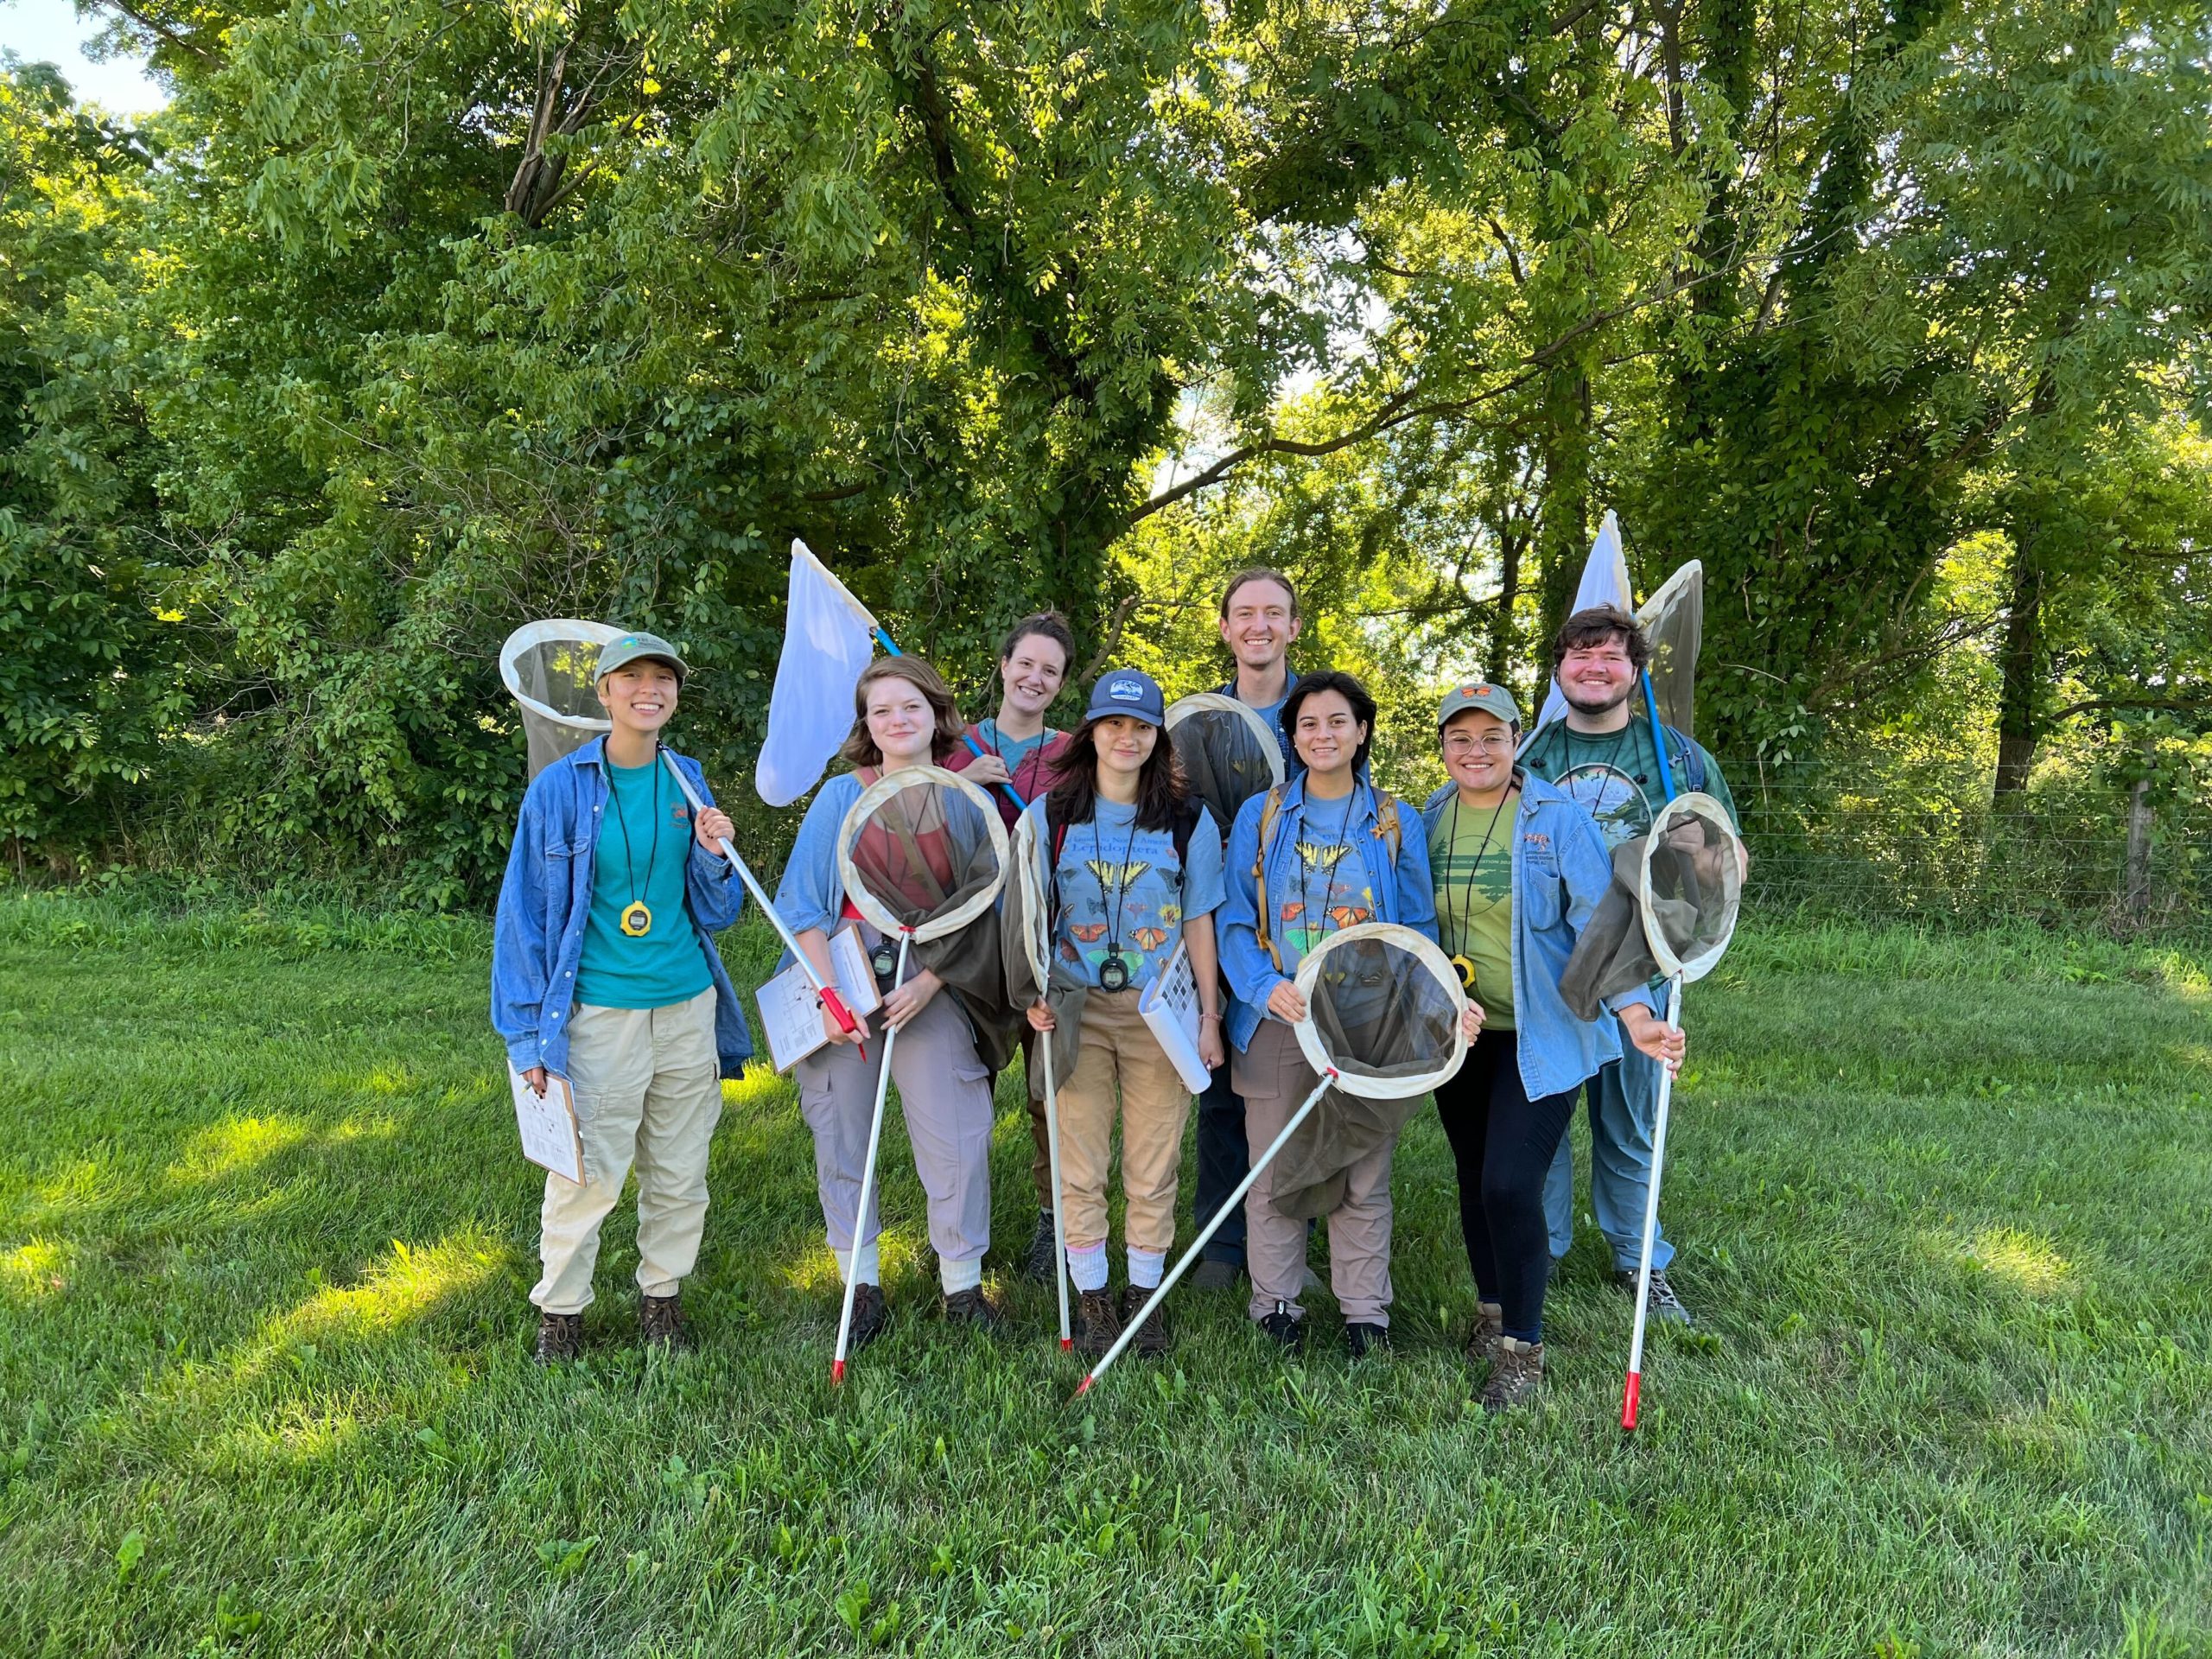
The sudden termination of our work is not only devastating for the programmatic and research team – it also wastes years of previous NSF-supported work and jeopardizes a future we envision filled with free, interactive learning resources to benefit millions of students and educators. In addition, the termination has directly prevented the hiring of 5 early career scientists as well as over 10 undergraduates who would have been trained in science communication, curriculum development, and discipline-based education research.
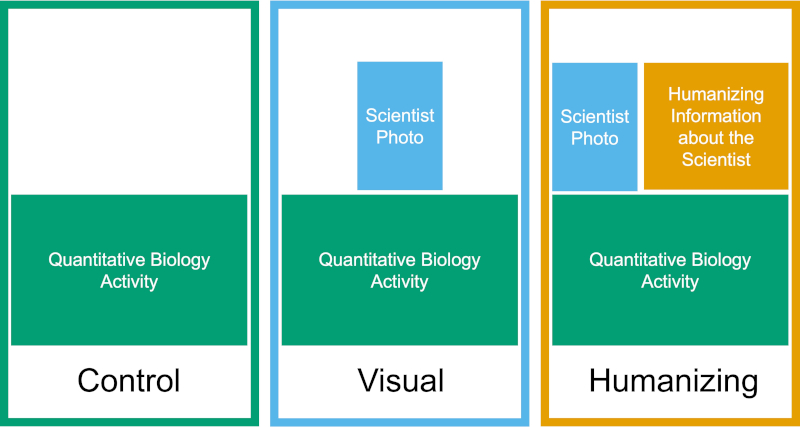
Our terminated grant, “Sharing Scientist Role Model Stories to Improve Equity and Success in Undergraduate STEM Education”, centered on further refining Data Nuggets to help more students see themselves in STEM careers. Past research by our team showed that sharing scientist stories within data literacy instruction was an effective way to engage students with the activities and help them relate to scientists. The goal of our terminated research was two-fold: first, to research and provide insight into how to effectively tell scientist role model success stories in instructional materials; second, to create a new set of freely available, evidence-based, educational resources for undergraduate biology classrooms.
The text of our termination letter mirrors many that we have seen, stating that they are “issuing this termination to protect the interests of the government … on the basis that [the grant] no longer effectuates the program goals or agency priorities. This is the final agency decision and not subject to appeal.” Because appealing a grant termination is one way for an institution to raise its voice to object to an unwarranted action, our team submitted an appeal through Michigan State University; Auburn University declined to submit our appeal.
We remain steadfast in our mission to support free educational resources and interactive learning worldwide, to spark interest in data literacy for all students, and to share the stories of researchers who represent the full spectrum of identities within the science community.
More than ever, please consider supporting our work by sharing how important NSF funding has been to developing and advancing resources for STEM education. As the proposed US tax and spending bill goes to the Senate, we encourage those who can to contact your representatives and urge them to support funding for the National Science Foundation (NSF), National Institutes of Health (NIH), the Environmental Protection Agency (EPA), and other science agencies. Now is the time to act: the current funding proposal would slash NSF funding dramatically. #SaveNSF
Together, we can keep the future of interactive learning open and growing.
Sincerely,
The Data Nuggets Team and Auburn University collaborators