Chinook salmon in Alaska.
The activities are as follows:
Pacific salmon are important members of freshwater and ocean food webs. Salmon transport nutrients from the ocean to freshwater habitats, and traces of these nutrients can be found in everything from trees to bears! Salmon also support sport and commercial fisheries, and are used for ceremonial purposes by Native Americans. Climate change poses a threat to salmon populations by warming the waters of streams and rivers where they reproduce. To maintain healthy populations, salmon rely on cold, freshwater habitats and may go extinct as temperatures rise in coming decades. Warm temperatures can cause large salmon die-offs. However, some salmon individuals have higher thermal tolerance and are better able to survive when water temperatures rise.
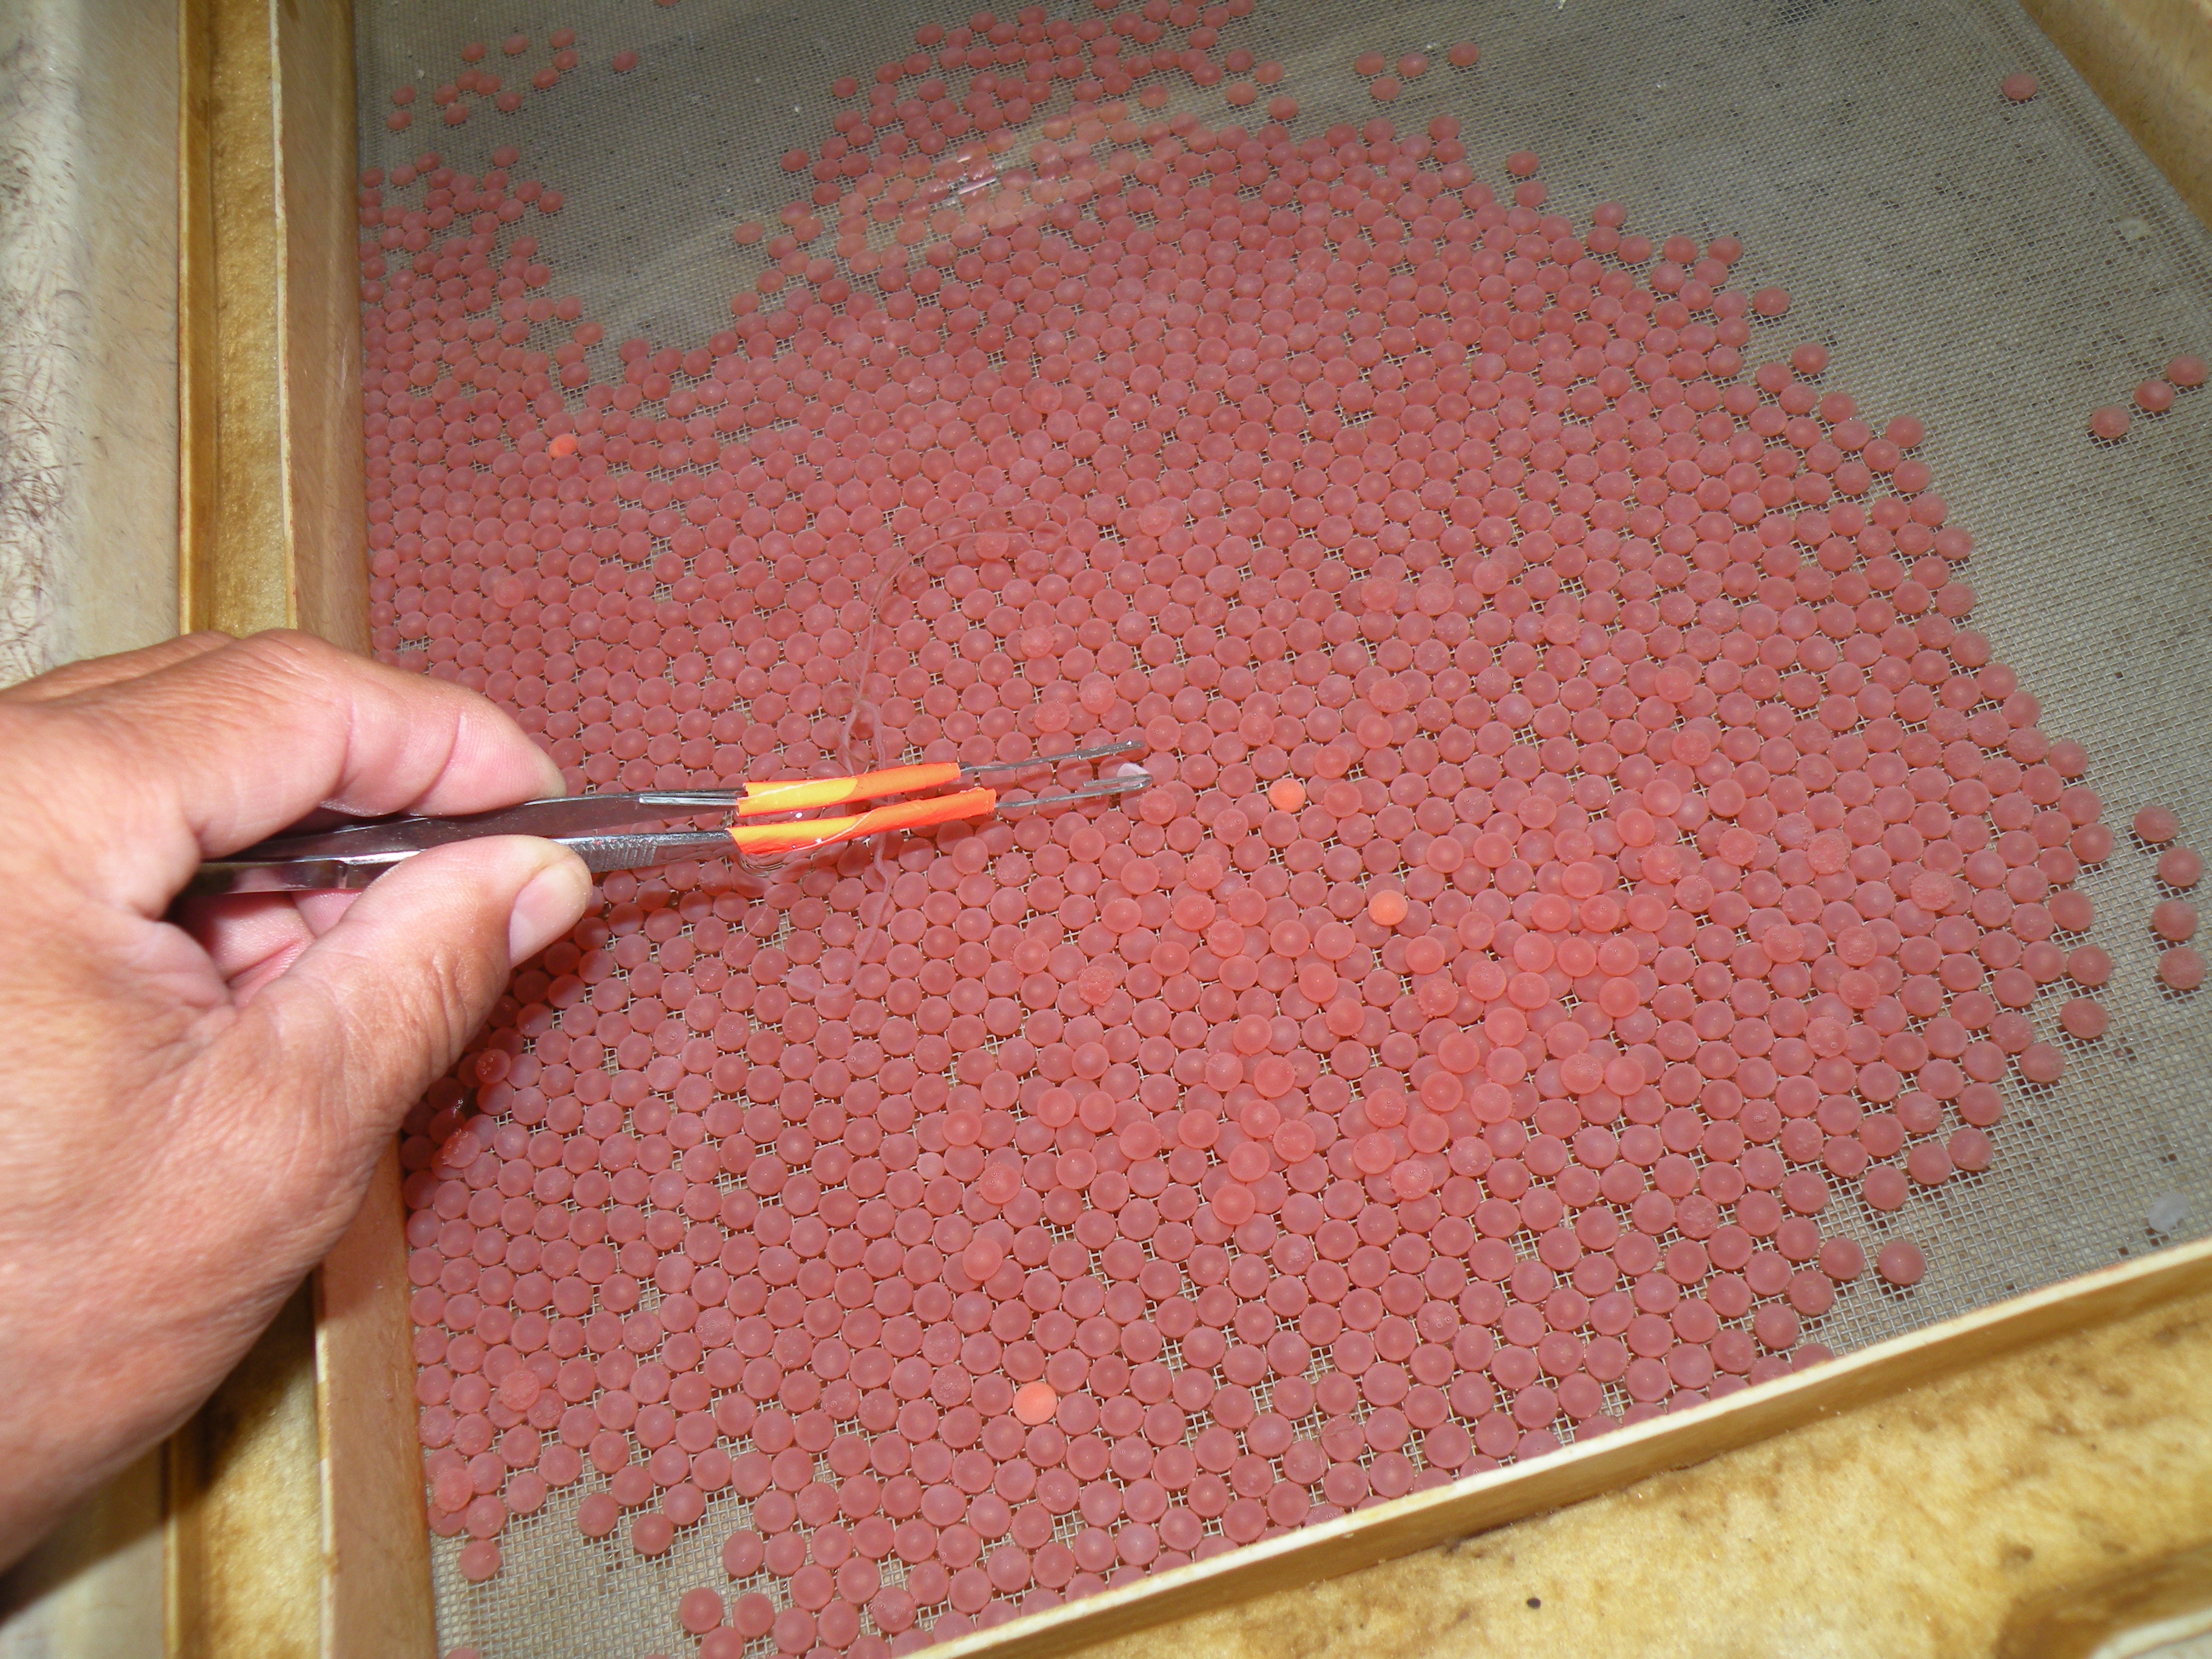
Eggs used in QTL experiment
Salmon individuals and populations may be better able to survive in warmer waters because they have certain gene variants that help them survive under these conditions. Scientists want to know whether there is a genetic basis for the variation observed in salmon’s thermal tolerance. If differences in certain genes control variation in thermal tolerance, scientists can identify the location on the genome responsible for this very important adaptation. Once identified, management agencies could then screen for these genes in populations of salmon in order to identify individuals that could better survive in a future warmer environment. Hatchery programs could also breed thermally tolerant fish in an attempt to preserve this important fish species.

Scientists working in the lab
To identify the genes responsible for a particular trait, scientists look for Quantitative Trait Loci (QTL). A QTL is a genetic variant that influences the phenotype of a polygenic trait, such as human height or skin color, and perhaps thermal tolerance in salmon. Scientists can find QTL by conducting experimental mattings then examining the phenotypic and genetic characteristics of the offspring. In this study, parent fish from one population of salmon, some that are tolerant to warm water and some that are not, mated and produced offspring. These offspring now had a mix of genetic backgrounds from their parents, meaning that some offspring inherited genetic variants that made them more tolerant to high temperatures and some did not. Each offspring was tested for their thermal tolerances, and had their genomes sequenced. Differences in the genome between offspring that are tolerant and those that are not reveal areas of the genome that are correlated with thermal tolerance and survival in warm water. If differences in certain genes control variation in thermal tolerance, the scientists predicted they could find regions in the salmon genome that are correlated with survival in warm water.
Featured scientists: Wesley Larson, Meredith Everett, and Jim Seeb from the University of Washington
Flesch–Kincaid Reading Grade Level = 10.9
There are two scientific papers associated with the data in this Data Nugget. The citations and PDFs of the papers are below. The lab webpage can be found here.
- Everett, M.V. and J.E. Seeb (2014) Detection and mapping of QTL for temperature tolerance and body size in Chinook salmon (Oncorhynchus tshawytscha) using genotyping by sequencing. Evolutionary Applications 7(4):480-492.
- Larson, W.A., L.W. Seeb, M.V. Everett, R.K. Waples, W.D. Templin, J.E. Seeb (2014) Genotyping by sequencing resolves shallow population structure to inform conservation of Chinook salmon (Oncorhynchus tshawytscha). Evolutionary Applications 7(3): 355-369.
Check out these Stated Clearly videos to explore DNA and genes with students!