The activities are as follows:
- Teacher Guide
- Student activity, Graph Type A, Level 4
- Student activity, Graph Type B, Level 4
- Student activity, Graph Type C, Level 4
- Grading Rubric
- Scientist profile
Carbon, when it is found in the soil, has a lot of benefits. Soil carbon makes water more available to plant roots, supports microbes and insects, helps water move through the soil and not flood at the surface, and holds on to critical nutrients for plants, like nitrogen and phosphorus. It is a key measure of soil health used by farmers.
The more carbon stored in soils, the less that ends up in our atmosphere as greenhouse gas, which contributes to climate change. Farming practices that increase soil carbon are a double benefit – they help crop plants grow and produce more return for farmers, while also helping to fight climate change.
Yet, accumulating carbon in the soil is a slow and mysterious process. It can take decades to see greater levels of carbon in most agricultural soils. Farmers need information about which farming practices reliably and continually increase soil carbon.

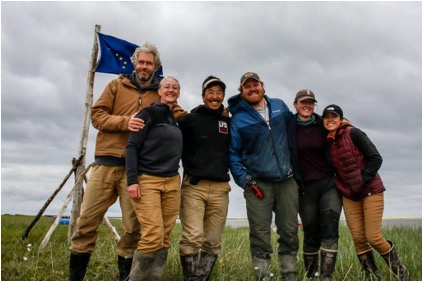
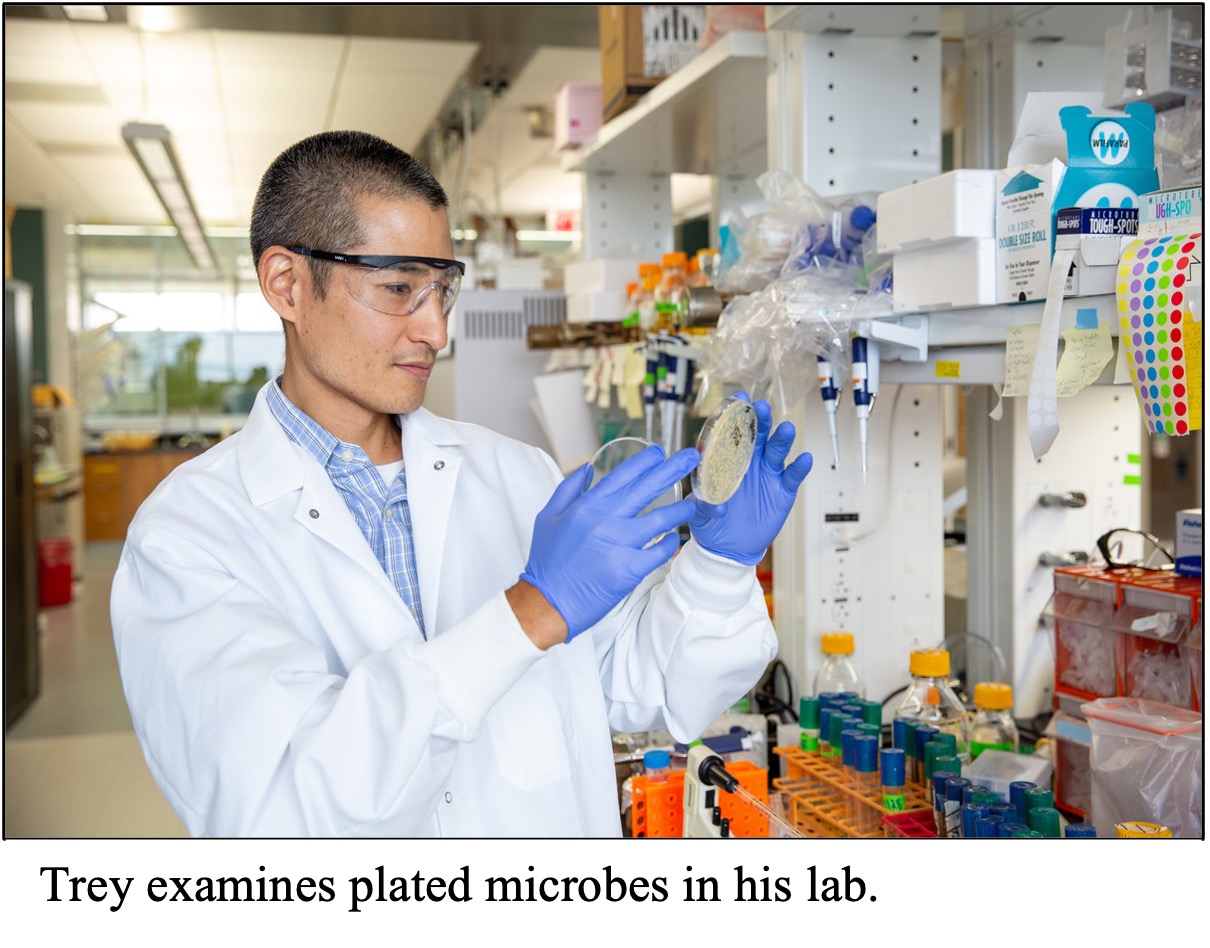
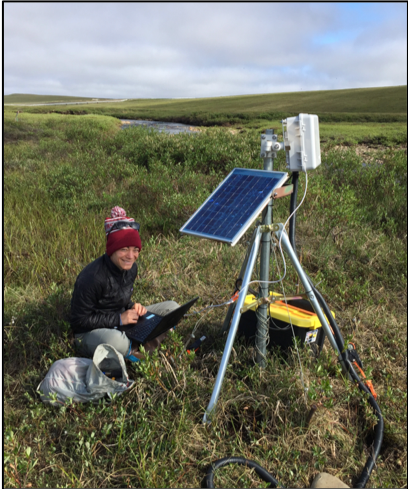
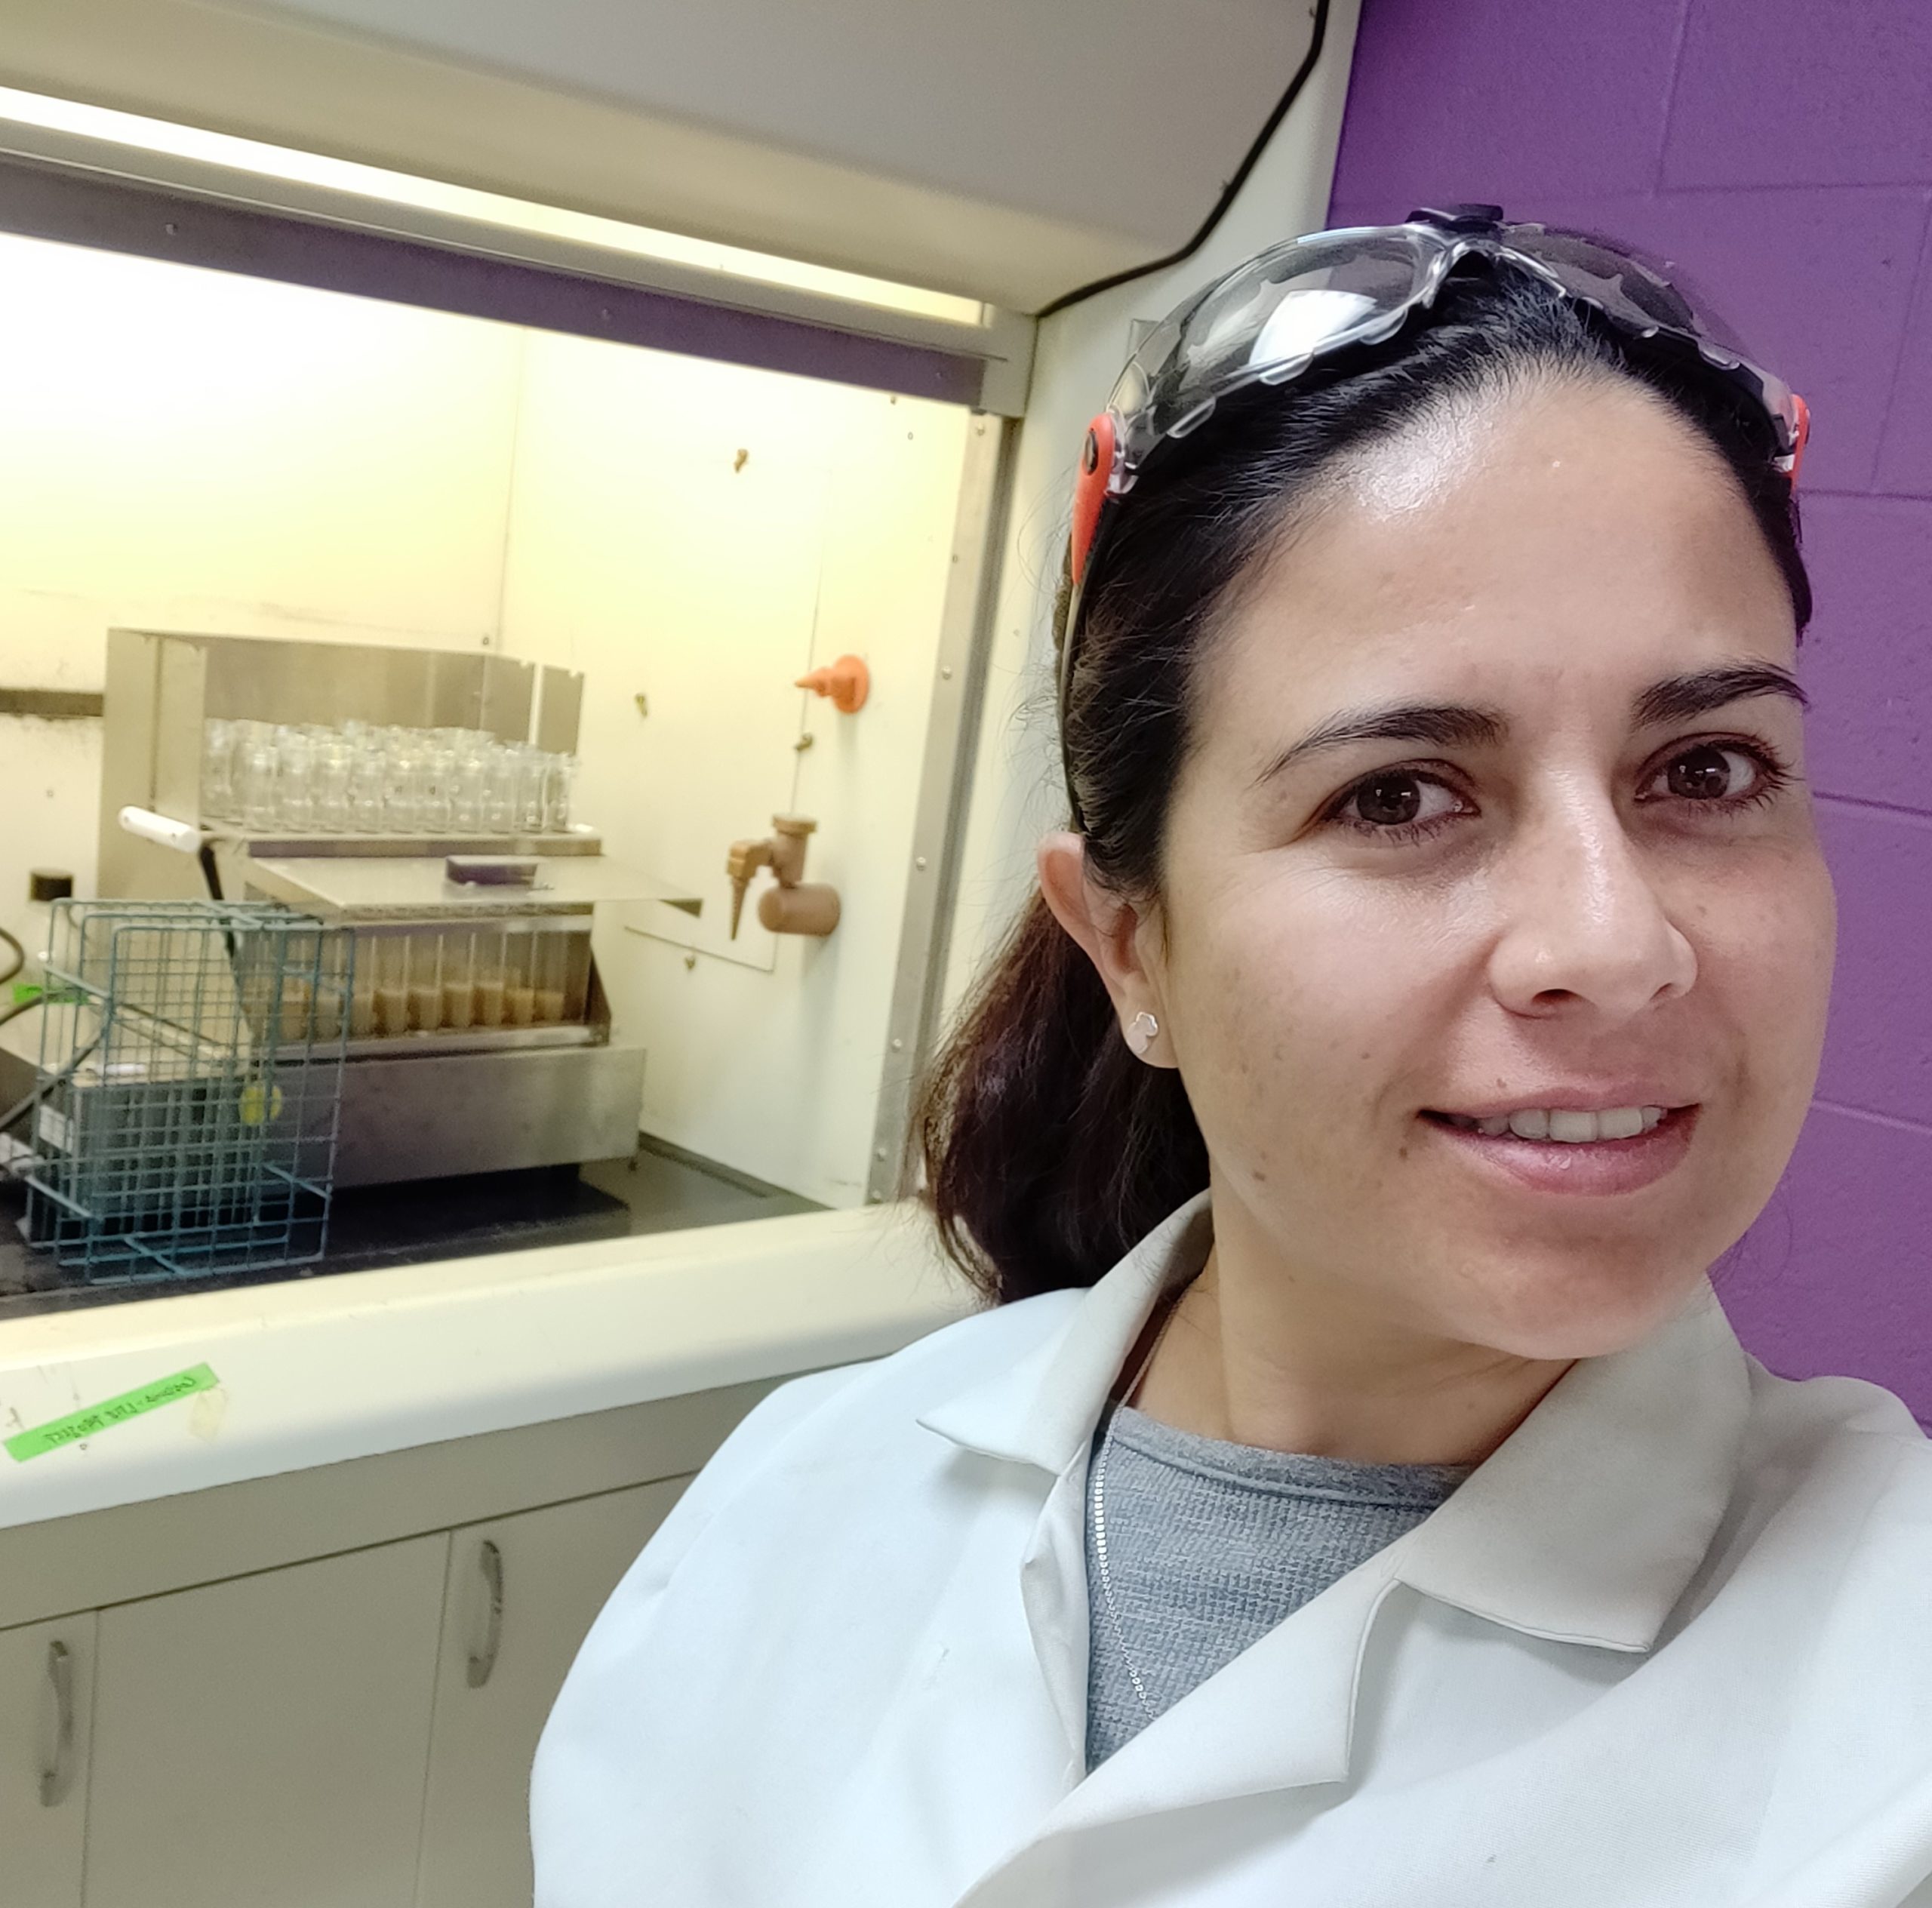
Caro is a soil scientist working with farmers to figure out how they can increase carbon in their soils. Her passion for soils brought her to the Kellogg Biological Station. This site is very special because it houses the Long-Term Ecological Research Program, which has been running the same experiment since 1989! When the study began, the soils were the same across the site. But, after decades of different treatments taking place in research plots, a lot has changed above and below ground.
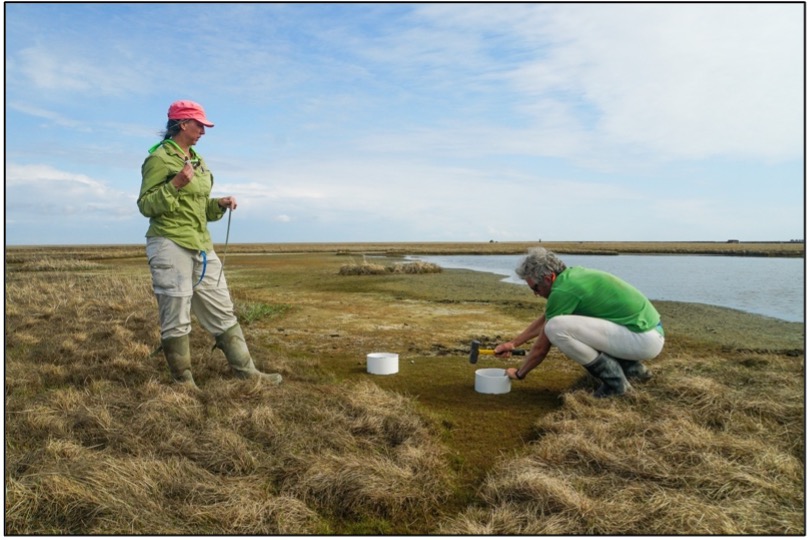
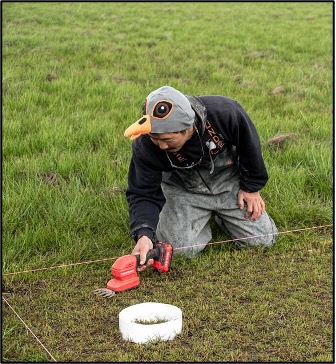
In 2013, a team of scientists worked to sample soil carbon at this site, 25 years after the experiment began. The team processed the samples to determine the percent, by weight, of each soil sample that is made up of carbon. This is called % soil carbon. They collected samples from 4 different treatments, each with 6 replicate plots:
(1) Conventional: plots grown in a corn soybean-wheat crop rotation. The soil in these plots is tilled during spring, meaning they are disturbed and turned over. These plots represent how agriculture is conventionally done in the area with standard chemical inputs of fertilizer, herbicides, and pesticides.
(2) No-till: plots that are grown in the same way as conventional, but with one key difference. The soil in these plots is not tilled, meaning it has been undisturbed for 25 years at the time of sampling.
(3) Cover crops: plots grown similarly to conventional, with a few key differences. First, cover crops were added. Cover crops are plants that are planted alongside crops or at times of the year when the main crop is not growing. This means the soil has living plant roots year-round, not just during the season with crops. Second, this treatment had no chemicals added; all nutrients came from the addition of manure. These plots were tilled.
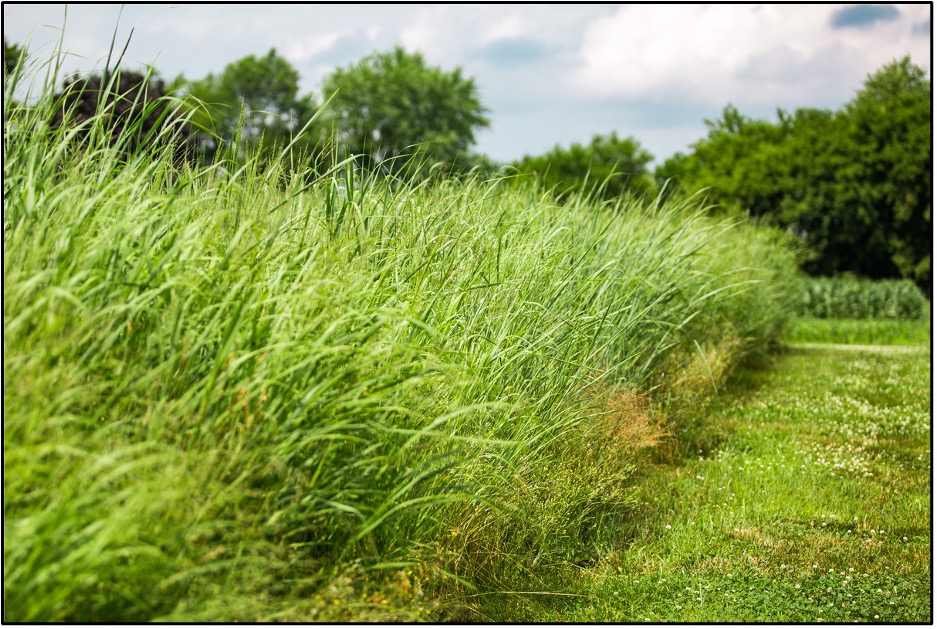
(4) Not farmed: non-agricultural plots growing in a diverse mix of plant species. Plots are unmanaged, but are sometimes burned to keep out woody species.
These 4 treatments represent different ways that land can be managed. The goal of the study was to see how different types of land management had changed % soil carbon over time. When Caro came to KBS in 2018, she was excited to see such a cool dataset waiting to be analyzed! She thought that keeping the soil undisturbed and having living roots in the soil for more of the year would increase soil carbon over time. This led her to predict that she would see higher % spoil carbon in the cover crop and no-till treatments, compared to conventional.
Featured scientist: Caro Córdova from University of Nebraska-Lincoln and the W. K.
Kellogg Biological Station Long Term Ecological Research Program.
Flesch–Kincaid Reading Grade Level = 4.1
Additional teacher resources related to this Data Nugget:
The results from this study are published and the article is available online.
Table 2 in the paper matches the dataset that students are working with in this activity.
If students want to read more about this paper, there is a blog post summarizing the study.
The full dataset is also available online in the Dryad Digital Repository. The file has lots of details about the variables measured and the different cropping systems studied. The first tab of the spreadsheet contains the data used in this activity, plus many more variables and treatments that students can explore to ask new questions!
More information on Regenerative Agriculture from MSU here.

These data are part of the Kellogg Biological Station Long Term Ecological Research Program (KBS LTER). To learn more about the KBS LTER, visit their website.