The activities are as follows:
- Teacher Guide
- Student activity, Graph Type A, Level 4
- Student activity, Graph Type B, Level 4
- Student activity, Graph Type C, Level 4
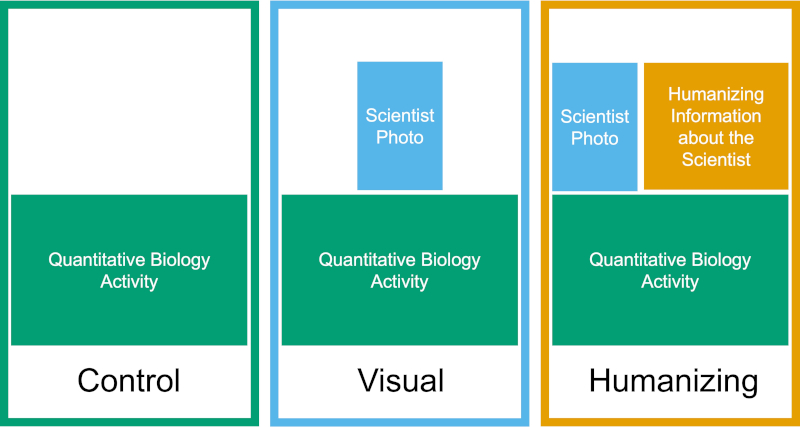
- Scientist Profile on Project Biodiversify
- Grading Rubric
Fossils are the ancient remains of organisms that existed thousands to millions of years ago. Scientists look through fossil records to learn about the lives of animals and plants that are extinct today. Fossils can hold clues about the environment, how species interacted with each other, what they ate, and even how they acted.
Holly found her first fossil at 6 years old when she visited a beach in the United Kingdom. It was a small piece of ancient coral. She thought it was amazing to see a remnant of how something looked over 350 million years ago! Holly loved that fossils allowed her to time travel and explore ancient worlds. She pursued her passion and today is a paleobiologist, or scientist who uses the fossil record to learn more about the biology of past organisms. This career has given her the opportunity to study thousands of fossils from many species, from dinosaurs to ancient humans. She has traveled all over the world, including Europe, North America, Asia, and Australia!
Holly specializes in using fossils to paint a picture of the lifestyles of ancient animals. She uses the shape, structure, damage patterns, and burial poses of bones, and compares them to modern bones. By using what we know about living species, Holly can reconstruct the life and death of ancient organisms.
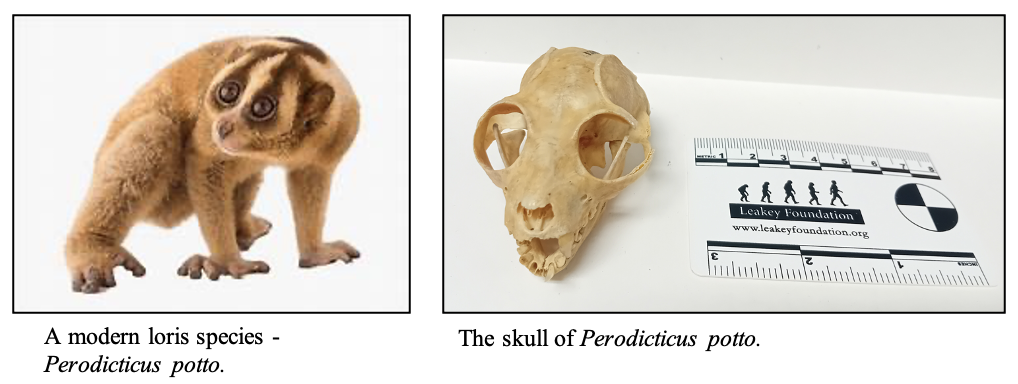
Recently, Holly teamed up with Mary, Sergi, Ingrid and Adam, because they were all scientists curious about the same species – an extinct primate called Mioeuoticus (phonetic: my-o-you-otikus). This animal is believed to be a relative of modern lorises. Lorises that are alive today live in the treetops of tropical forests in India, Sri Lanka, and southeast Asia. Lorises move very slowly and are nocturnal, which means they are typically active at night.
Holly and her colleagues wanted to know whether Mioeuoticus were nocturnal like their loris relatives. By reconstructing the behaviors of related species through time, the team can map out whether the ancestors of modern species behaved the same way since their origin.
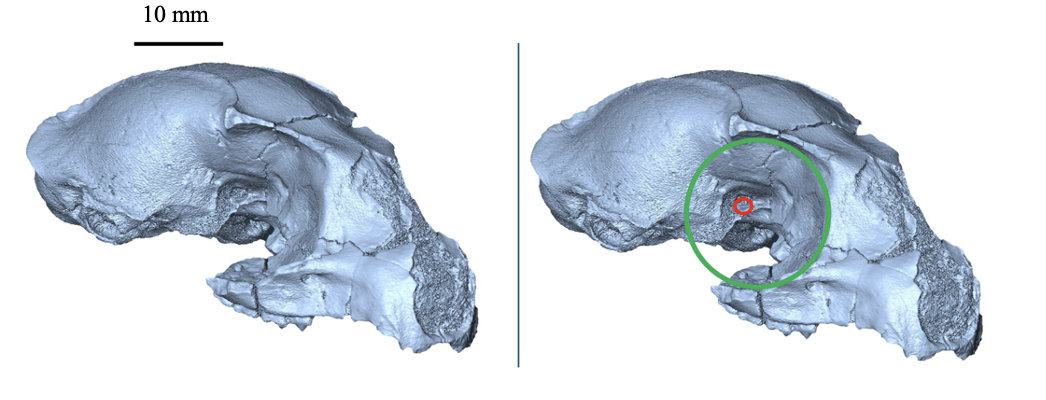
There are a few traits from an animal’s skull that can serve as clues. For example, nocturnal animals typically have larger eyes to increase their ability to see at night. Therefore, animals that have proportionally larger orbital cavities, or eye sockets, are likely to be nocturnal.
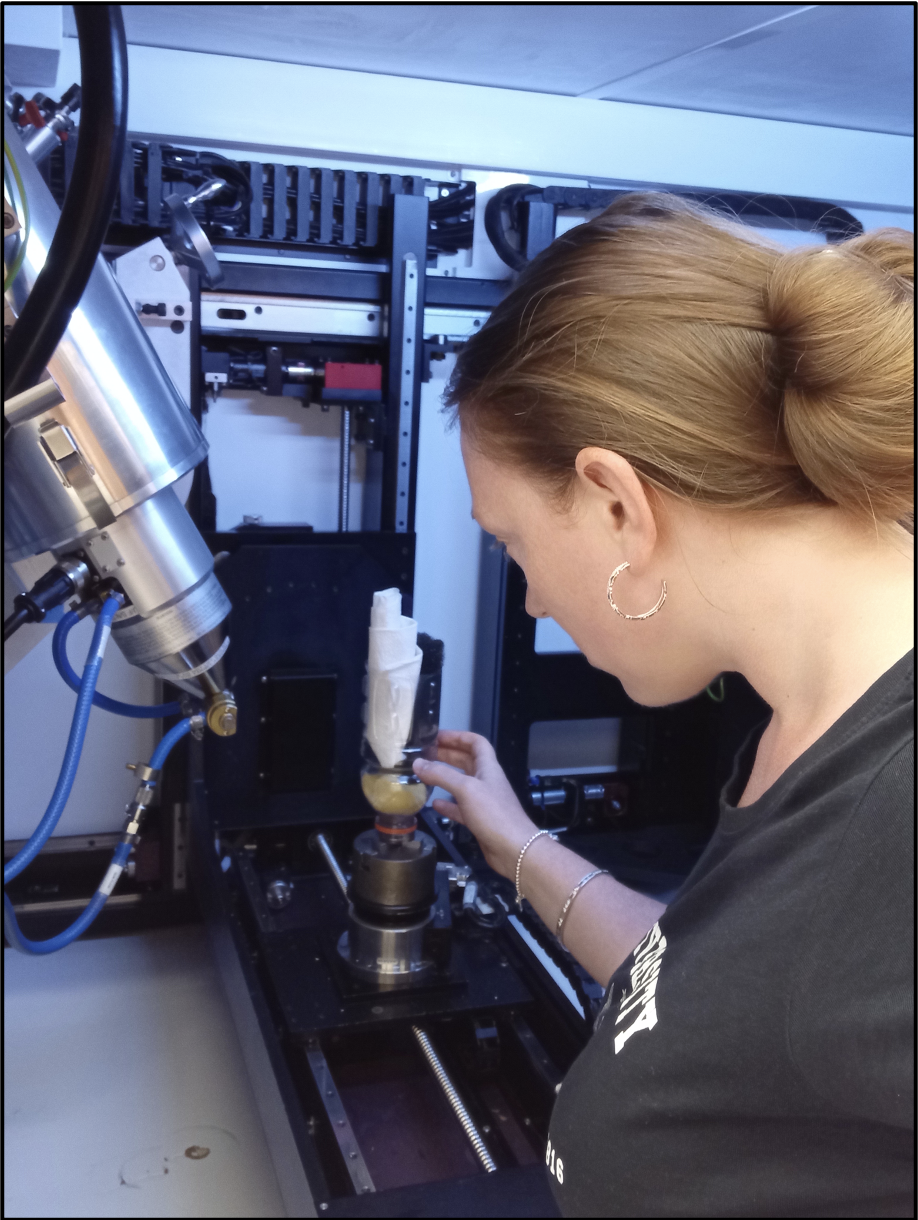
There is only one Mioeuoticus skull in the whole fossil record! To answer their question, the research team first measured the orbital cavities of the fossil. They used a computer software program designed to precisely measure 3-dimensional scans of bones. Using this technology, Holly obtained the diameter and area of the Mioeuoticus orbital cavities.
They then had to compare the fossil values to values of modern species that are alive today. To do this, the team looked through published data collected by other scientists. They found values for the same features in nocturnal lorises and other primate groups. They compared the value from their fossils to three primate groups:
- diurnal – active during the day
- cathemeral – active during both the day and night
- nocturnal – active at night.
In order to compare primates with different body sizes, the team used an index that looks at relative orbital size. This index uses an equation to scale the orbital measurements relative to body size. If Mioeuoticus were nocturnal, Holly predicted the relative orbital size to be similar to the strepsirrhines that have been observed to be nocturnal because this group includes the closest living relative, the lorises.
Featured scientist: Holly E. Anderson (she/her) from Warsaw University, Poland Collaborating scientists: Mary Silcox, Sergi López-Torres, Ingrid Lundeen, & Adam Lis
Flesch–Kincaid Reading Grade Level = 10.1
Additional teacher resources related to this Data Nugget:
Check out this publication related to the research in this activity:
Anderson, H. E., Lis, A., Lundeen, I., Silcox, M. T., & López-Torres, S. 2025. Sensory Reconstruction of the Fossil Lorisid Mioeuoticus: Systematic and Evolutionary Implications. Animals: 15(3), 345. DOI: 10.3390/ani15030345