In May of 2025, the NSF terminated our collaborative Data Nuggets grant between Michigan State University and Auburn University titled, “Collaborative Research: Sharing Scientist Role Model Stories to Improve Equity and Success in Undergraduate STEM Education”. At the time of termination over $1 million in unspent funds remained, which would have gone towards personnel and research activities.
In response to situations like ours, where research was disrupted by changes to Federal policy, Michigan State University launched the Jenison Fund Career and Research Continuity Support program. This strategic initiative led by MSU’s Office of the President, Provost, and Office of Research and Innovation to provide targeted support for projects like ours that were cancelled but can be brought to a meaningful pause point.
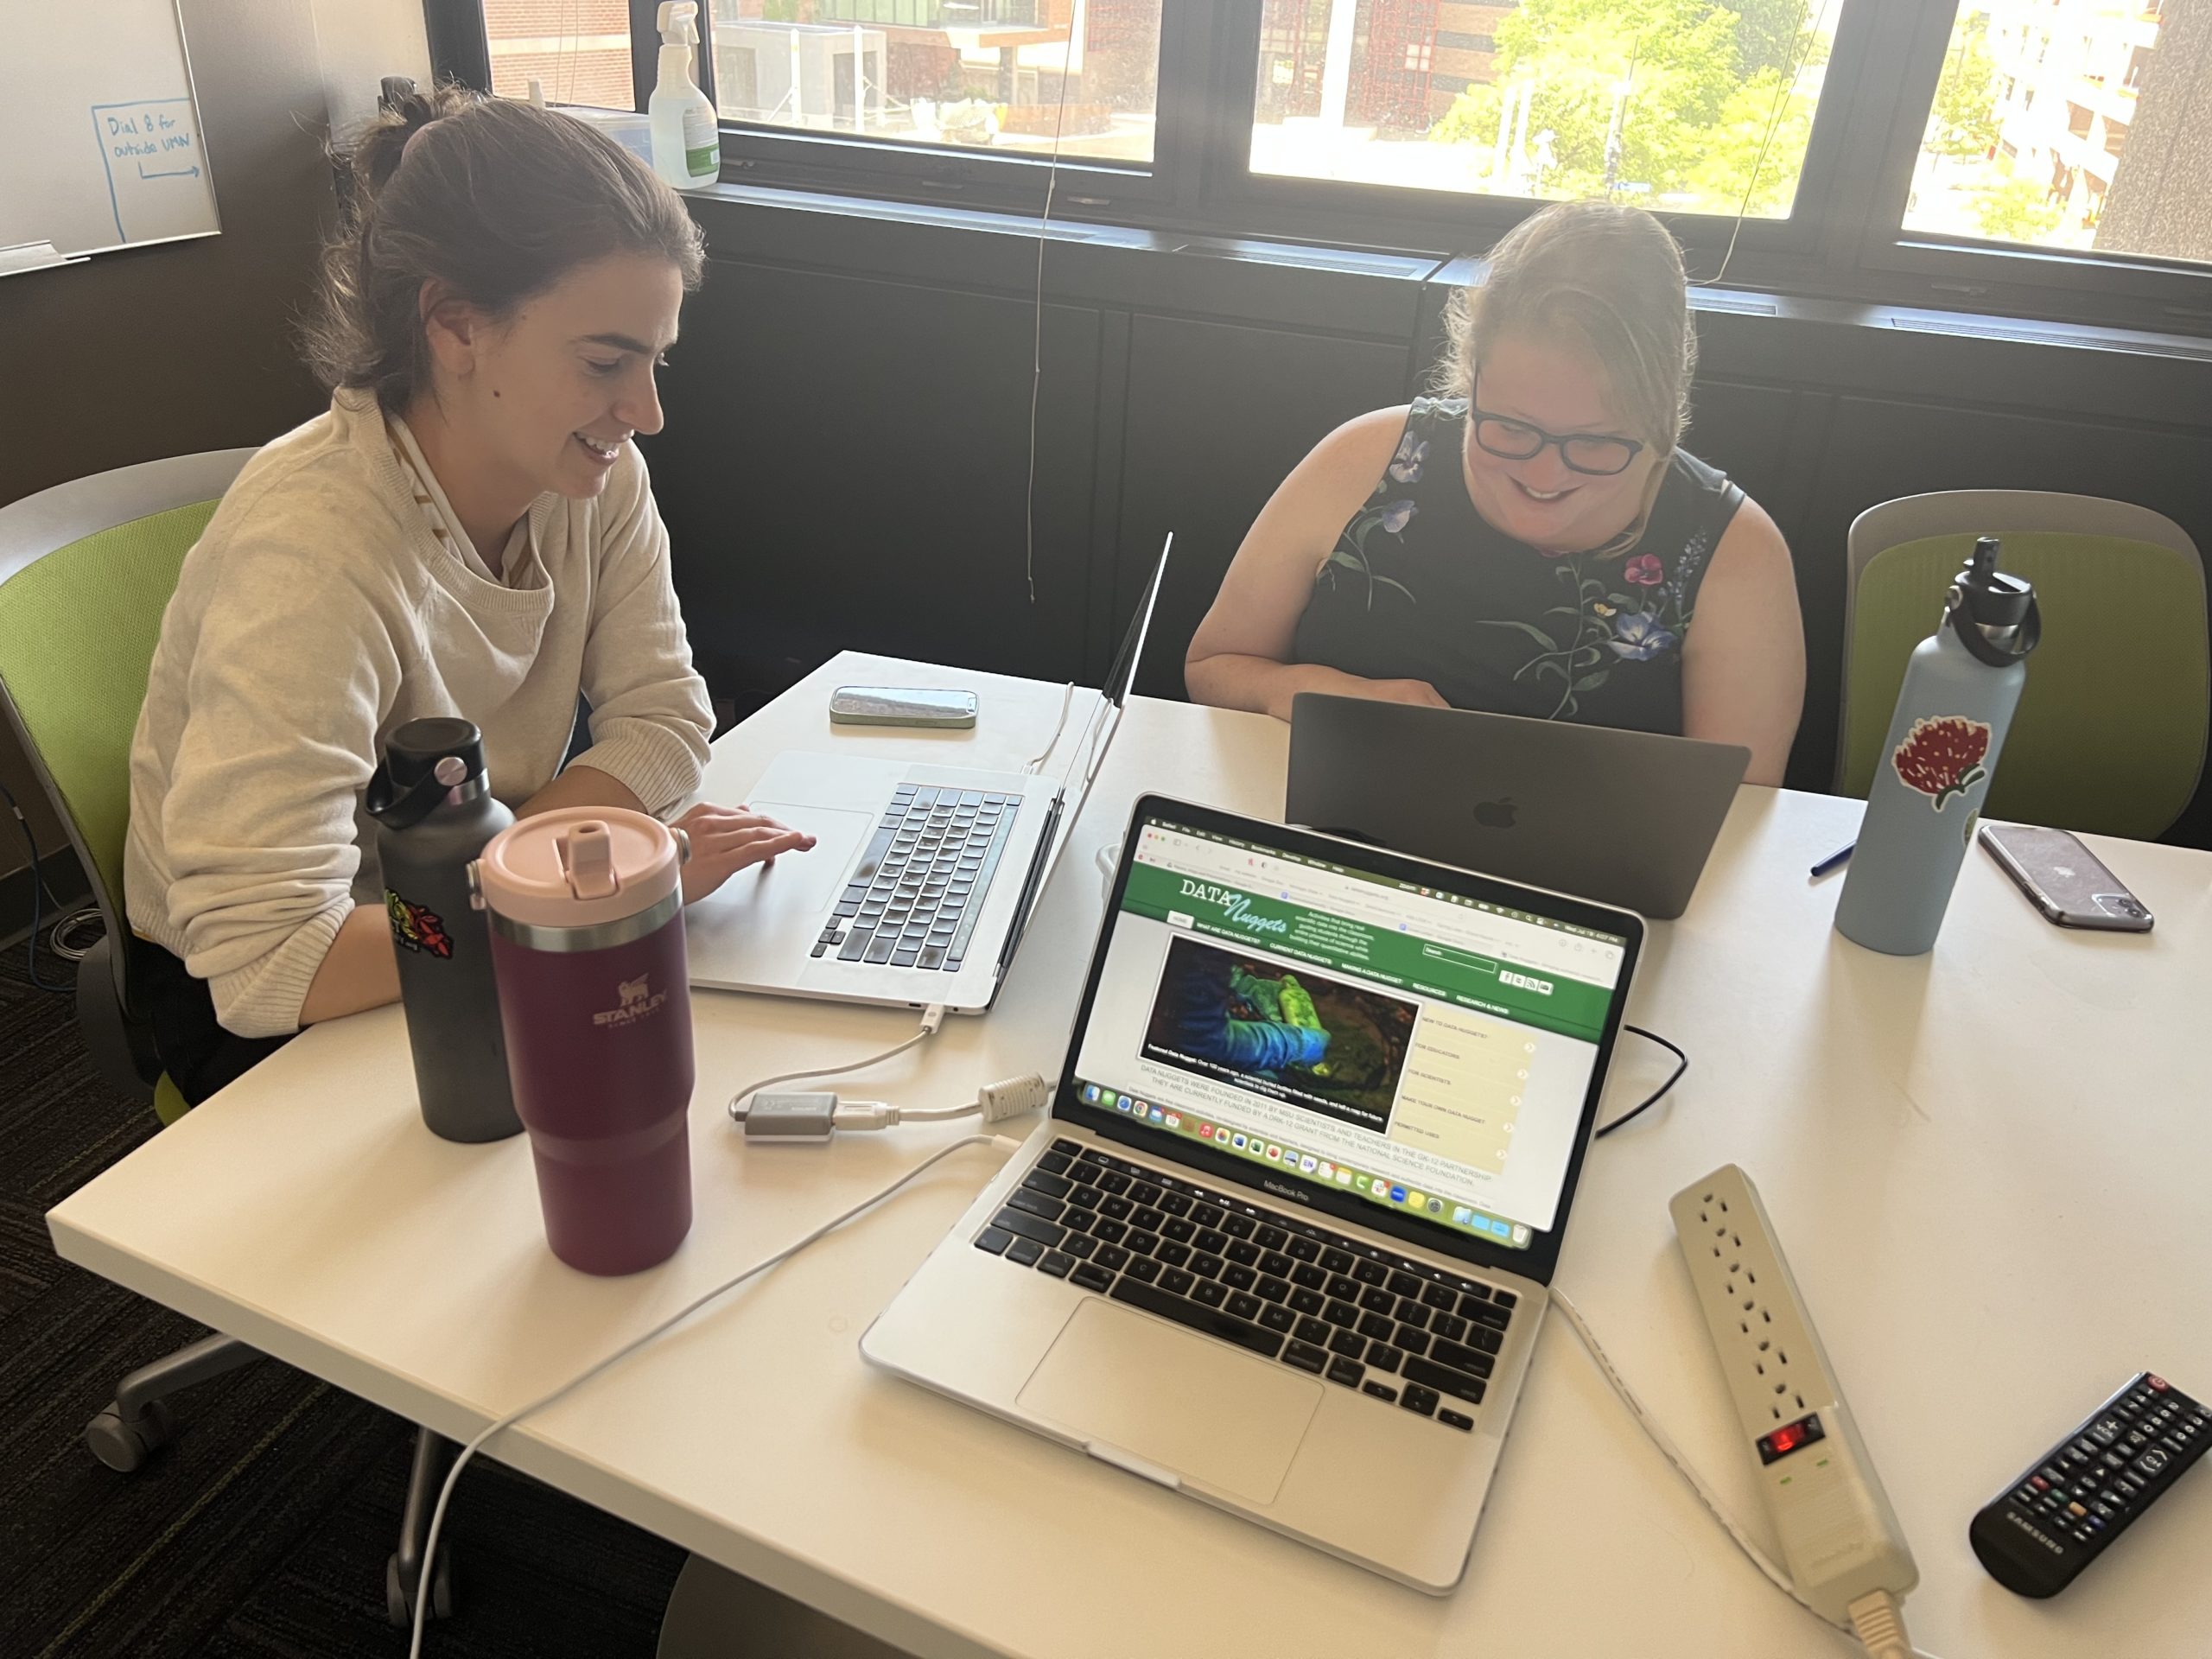
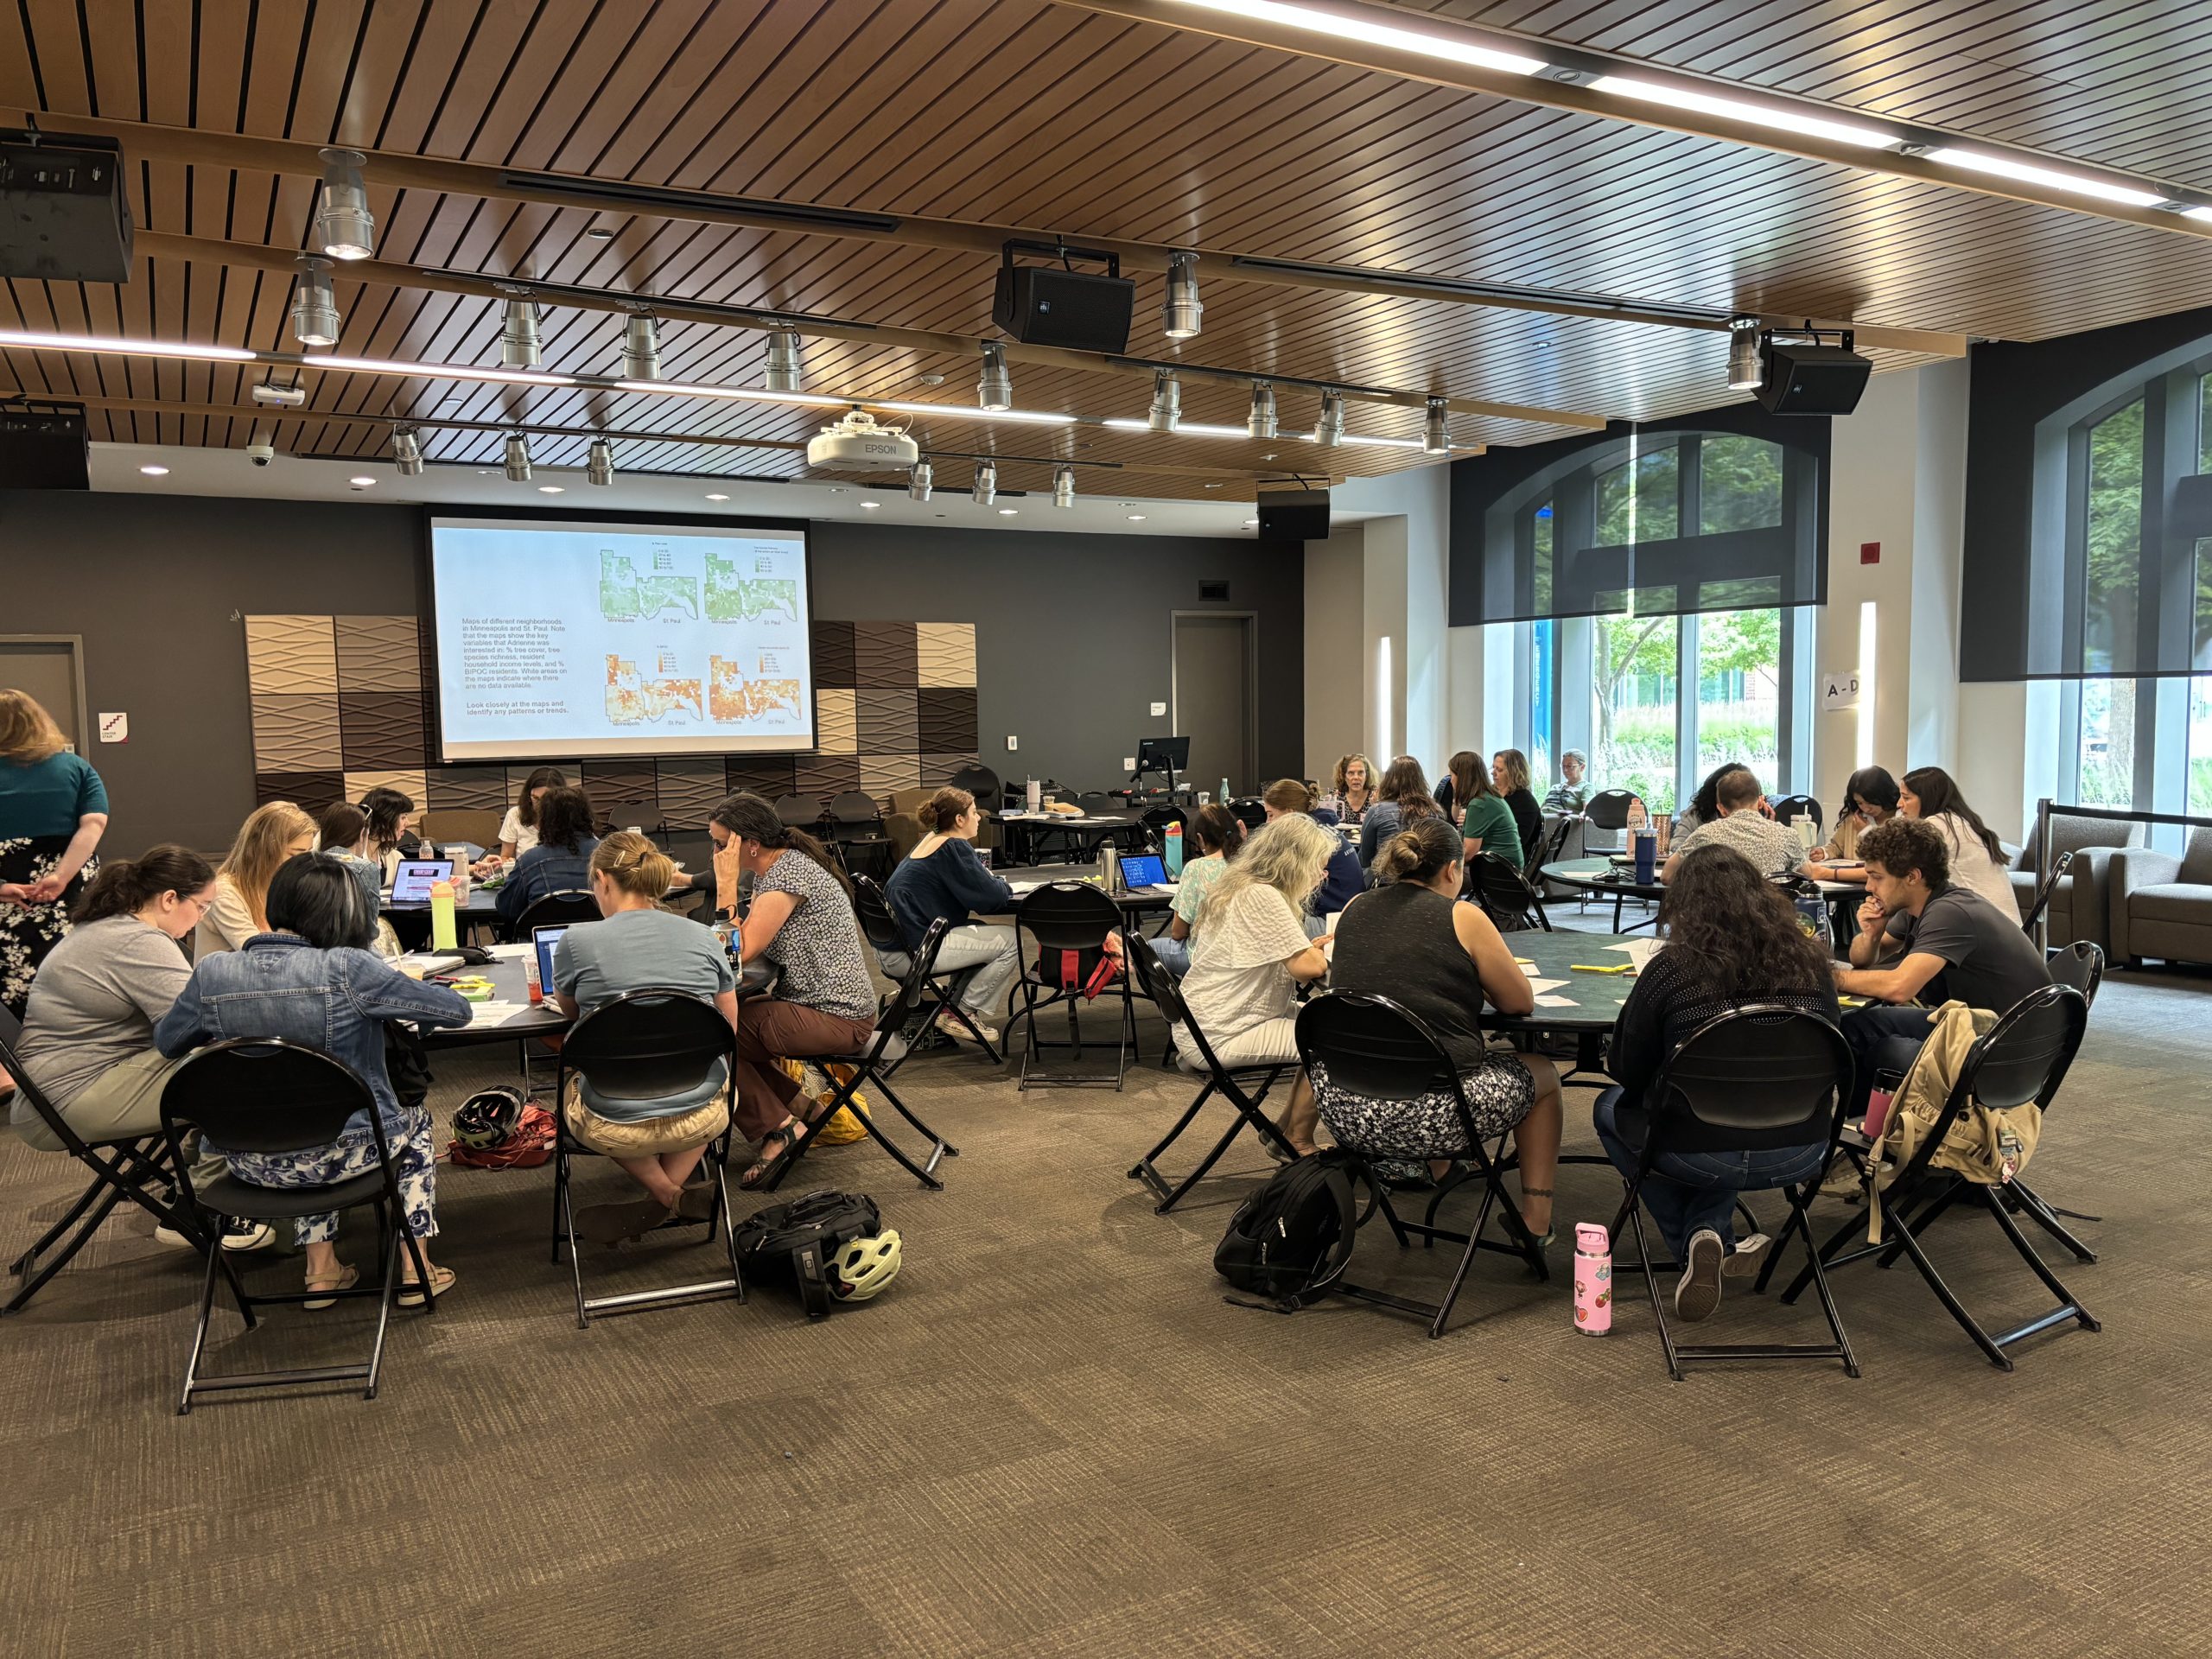
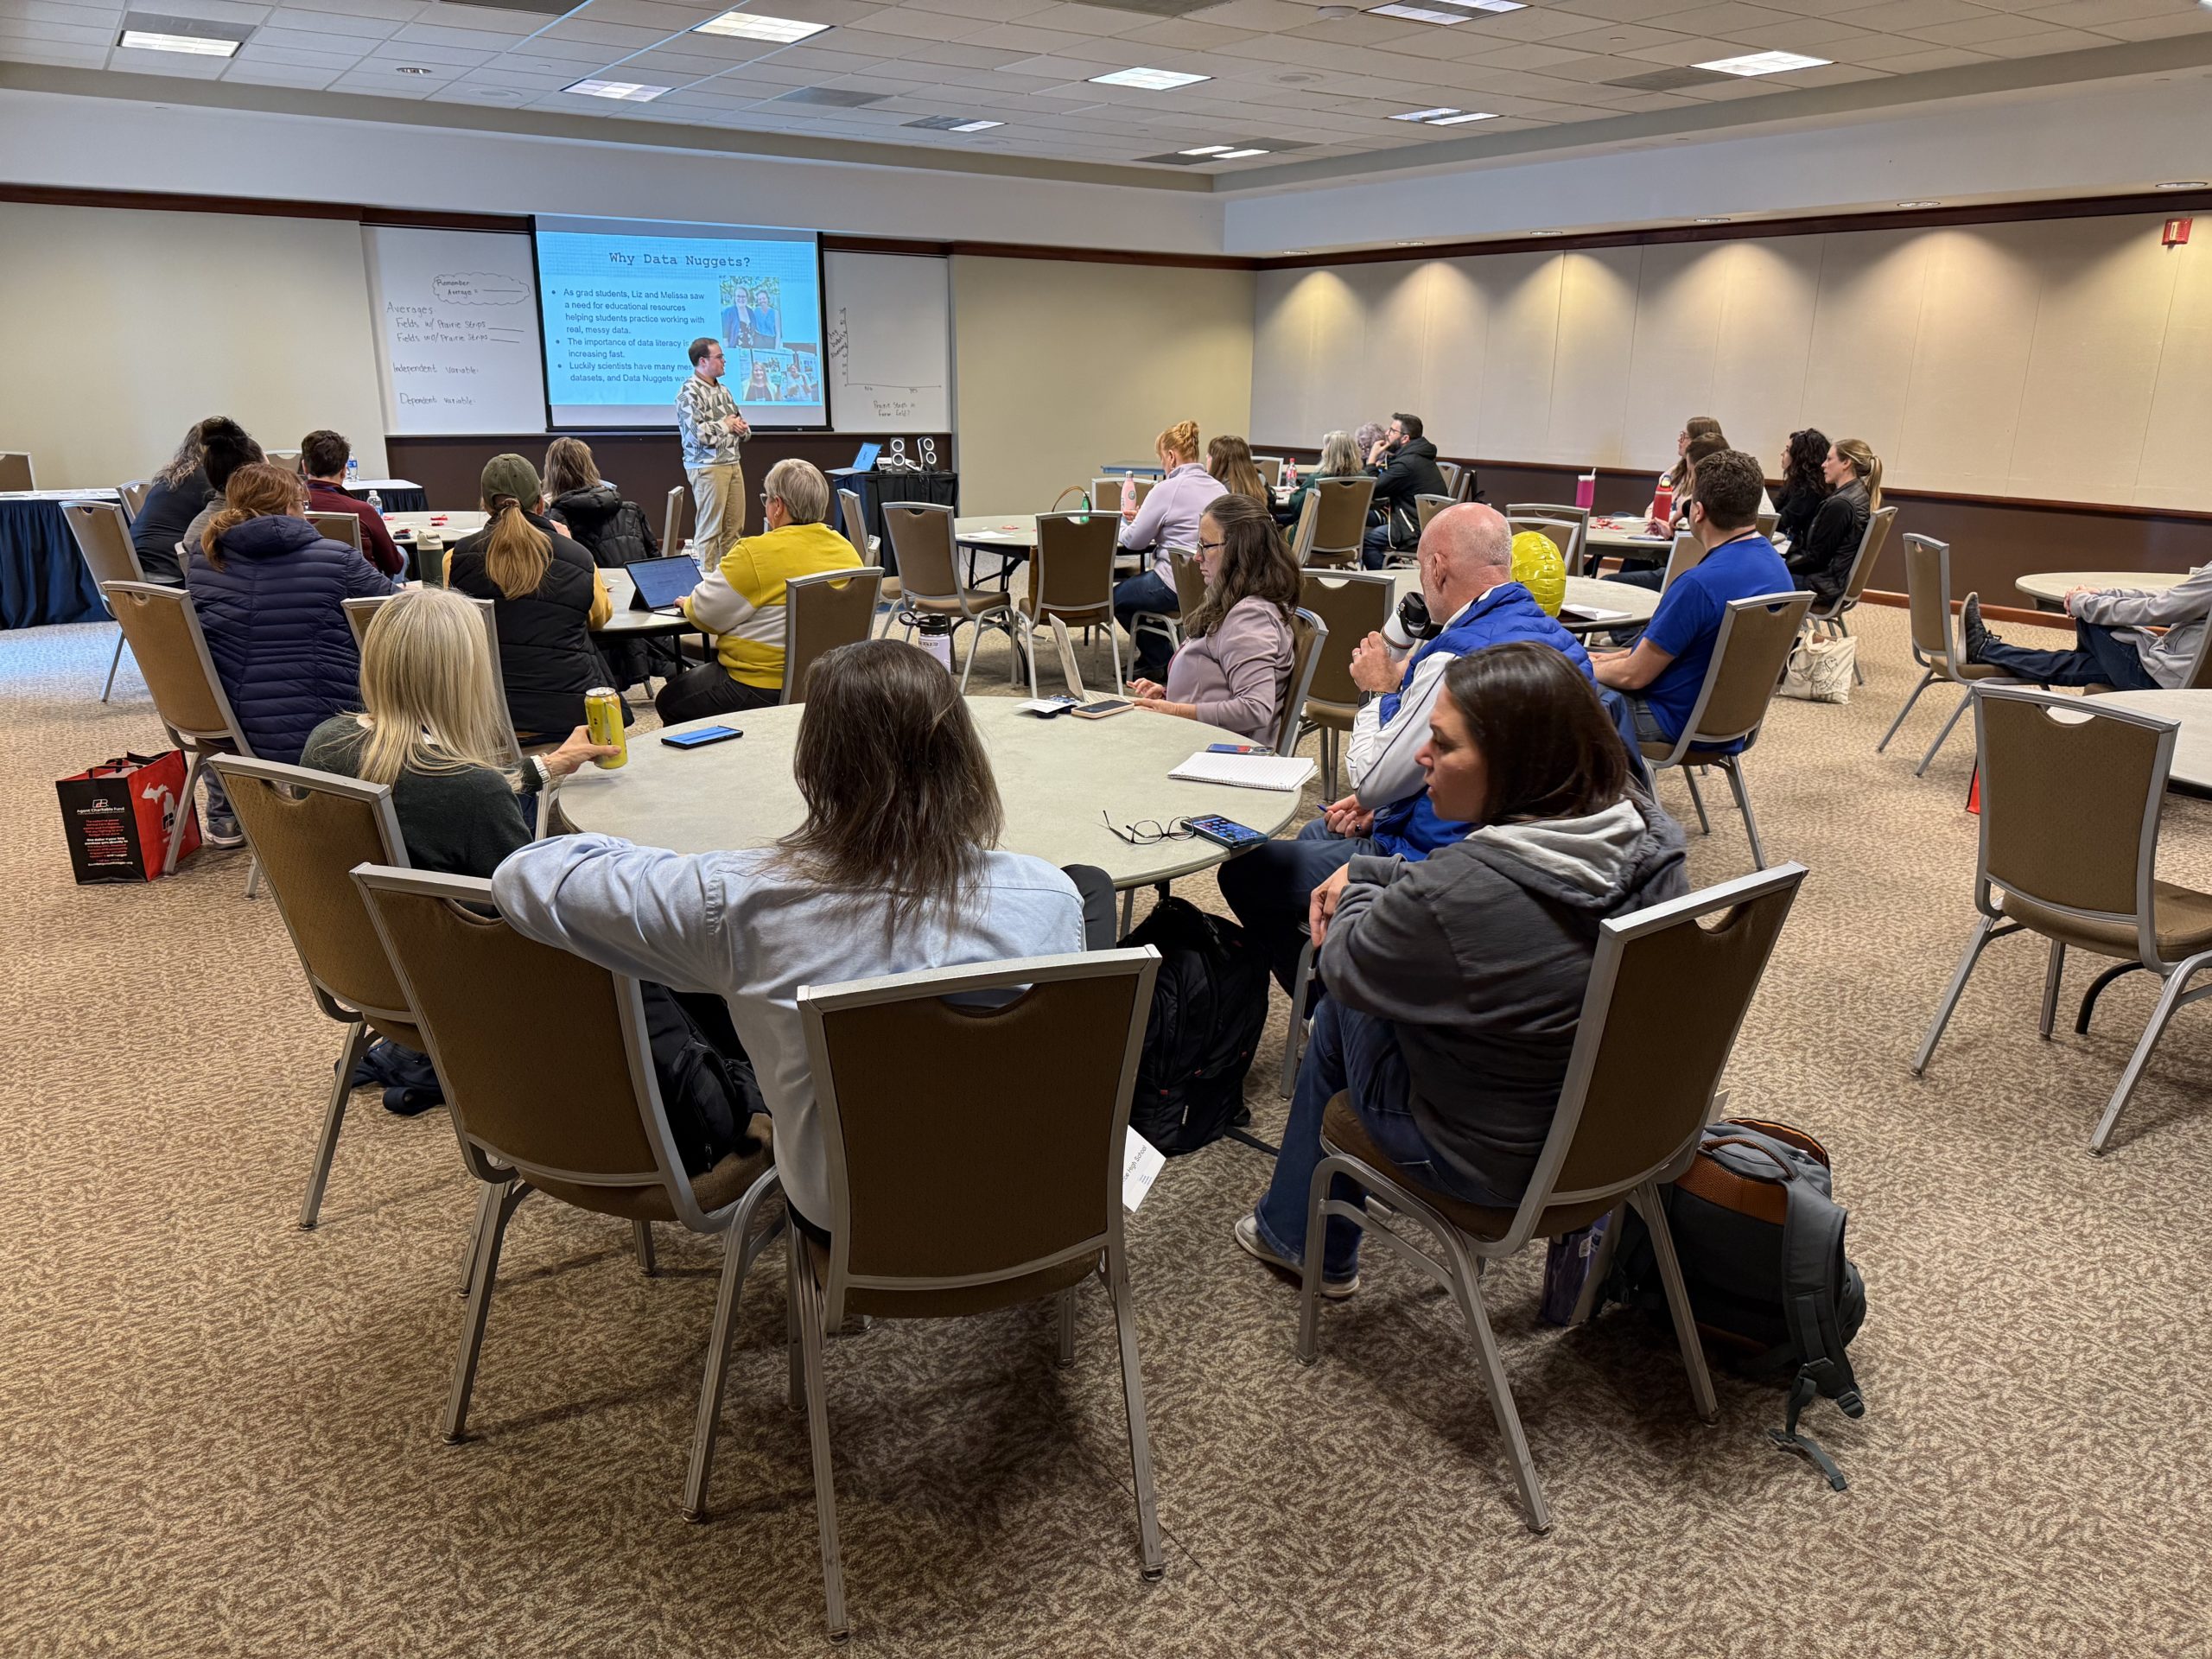
The Jenison Fund offers our collaborative team the ability to complete a paired-down version of our proposed study and continue the Data Nuggets program. We are using this time to seek future funding support, continue developing data literacy and science role model resources, and complete a research study undergraduate classrooms.
Thank you for your interest in Data Nuggets, and for supporting our work as we navigate these challenges and envision the future of the Data Nuggets program!