Stop that oxidation! What fruit flies teach us about human health

Laboratory fruit flies in their natural habitat: a plastic vial. Photo credit: Conni Wetzker

The activities are as follows:

Have you ever eaten an apple and noticed that, after a while, the core turns brown? That’s because of oxidation – a chemical reaction between the oxygen in the air and the inside of the apple. The same thing is happening inside our own bodies all the time.

Each of our cells is home to mitochondria, tiny factories whose job is to turn the food we eat into the energy we need to live. But mitochondria also make molecules called reactive oxygen species, or ROS. As the name suggests, these molecules contain oxygen and tend to react with the things around them. Like the oxygen in the air reacting with the apple core and turning it brown, ROS react with different parts of the cell, causing oxidative damage. Everything in the cell, including our DNA, can be damaged by ROS molecules. Too much damage contributes to diseases including cancer, heart disease, diabetes, and Parkinson’s.

Bodies can prevent oxidative damage in two ways. First, they can use antioxidants. Antioxidants work by reacting with ROS to stop them from harming cells. Some antioxidants come from the food we eat, while others are made inside the body. If a body doesn’t have enough antioxidants, it can get sick. One example is a genetic mutation called DJ-1. It stops the body from producing antioxidant molecules. Many people with Parkinson’s disease, a neurological illness, have this DJ-1 mutation.

Some living things have evolved a second way to stop oxidative damage: their mitochondria actually make fewer ROS! These species have a special protein called alternative oxidase, or AOX. It works by shortening the pathway that mitochondria use to turn food into energy. A shorter pathway means fewer ROS are made. Scientists have been able to take the AOX gene and move it into other species.

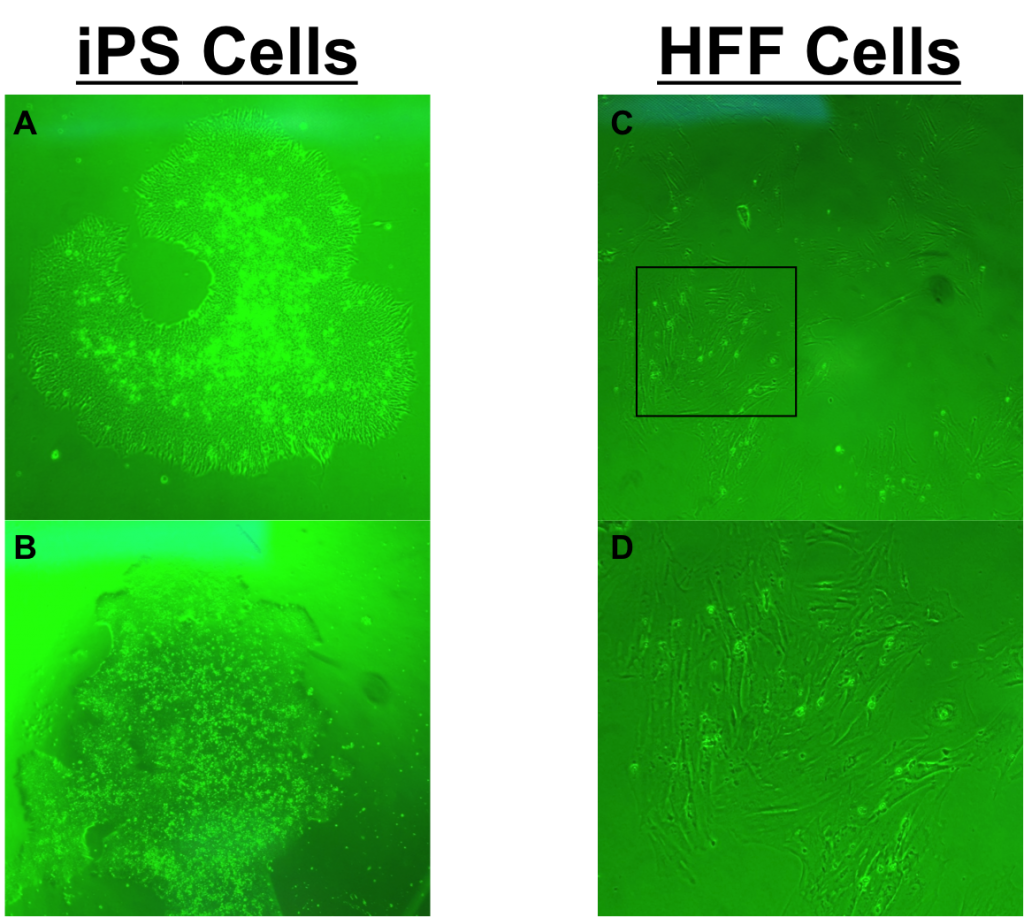
Biz, a scientist studying oxidative damage, wanted to study the effects of the DJ-1 mutation and the AOX gene. To do their research, Biz uses fruit flies. Fruit flies are useful because they are easy to work with and scientists can control the types of mutations and genes they have in the lab. Some of these mutations are the same as those found in humans, so scientists can use them to study human disease. In one study, scientists were able to take the AOX gene and put it into the fruit fly. Fruit flies can also have the DJ-1 mutation that stops antioxidants from being made. Biz used these genetic tools to work with flies that have less oxidative damage (AOX mutants), more oxidative damage (DJ-1 mutants), or normal levels (controls).

Biz was interested in how AOX and DJ-1 affect reproductive cells – sperm and eggs. Oxidative damage is even more dangerous for reproductive cells than for other cells. Whereas most cells can just self-destruct or stop replicating when they build up too much damage, sperm and eggs have to stay healthy up until the moment of fertilization. This wait can last a long time. In many species, females store the male’s sperm inside their own bodies for days, months, or even years after mating! In addition to making their own ROS and antioxidants, sperm and egg cells stored inside the female can be damaged or protected by ROS and antioxidants made by the female’s reproductive tract. Either way, damage to reproductive cells is very important because it can be passed on to future generations or can cause the offspring to die.

Biz wanted to test whether the level of oxidative damage in eggs and stored sperm would influence how many offspring a female had. If cells with oxidative damage do not produce healthy offspring, then fruit flies with less damage should have more offspring.  Biz also expected that fruit flies with more damage should have fewer offspring. To test these ideas, Biz mated normal male fruit flies to three groups of females: females with the AOX gene, females with the DJ-1 mutation, and normal (“control”) females. Aside from having the AOX or DJ-1 gene, the females in all treatments were genetically the same. The males used in the experiment were also genetically identical. After the males and females mated, Biz counted the number of surviving offspring from each group.

Featured scientist: Biz Turnell from Cornell University and Technische Universität Dresden

Flesch–Kincaid Reading Grade Level = 9.0

To bee or not to bee aggressive

A honey bee (Apis mellifera) collecting nectar to bring back to the hive. Photo by Andreas Trepte.

The activities are as follows:

Honey bees are highly social creatures that live in large colonies of about 40,000 individuals and one queen. Every member of the hive works together to benefit the colony. Some of the tasks adult bees perform include making honey, nursing young, foraging for food, building honey comb structures, and defending the colony.

From spring through fall, the main task is turning nectar from plants to honey. The honey is stored and eaten over the winter, so it is vital for the colony’s survival. Because honey is an energy-rich food source, hives are targets for break-ins from animals, like bears, skunks, and humans that want to steal the honey. Bees even have to fight off bees from other colonies that try to steal honey. Research shows that colonies adjust their defenses to match threats found in their environment. Hives in high risk areas respond by becoming more aggressive, and hives that do not face a lot of threats are able to lower their aggression. This flexibility makes sure they do not waste energy on unnecessary behaviors.

Clare is a scientist studying the behavior of social animals. There is an interesting pattern seen in other social animals, including humans, that Clare wanted to test in honey bees. In these species, the social environment experienced when an individual is young can have lasting effects on their behavior later in life. This may be because this is the time that the brain is developing. She thought this would likely be the case with honey bees for two reasons. First, bees can use social information to help coordinate group defense. Second, young bees rely completely on adult bees to bring them food and incubate them, so there are a lot of social interactions when they are young. After reading the literature and speaking with other honey bee experts, Clare found out that no one had ever tested this before!

Honey bee larva (top) and an emerging adult (bottom).

Clare chose to look at aggression level as a behavioral trait of individual bees within a colony. She predicted that young honey bees raised in an aggressive colony would be more aggressive as adults, compared to honey bees raised in a less aggressive colony. To test her predictions, Clare used 500 honey bee eggs from 18 different queens. To get these 500 eggs she collected three times in the summer, for two years. Each time she collected, she went to two different locations. Collecting from so many different queens helped Clare make sure her study included eggs with a large genetic diversity.

To test her questions, she used these eggs to set up an experiment. Eggs from each of the 18 queens were split into two groups. Each group was put into one of two types of foster colonies – high aggression and low aggression. Clare determined whether each foster colony was considered high or low aggression using a test. Because half of each queen’s eggs went into a low aggression foster colony, and the other half in a high aggression foster colony, this represents the experimental treatment.

Clare left the foster colonies alone and waited for the bees to develop in the hives. Eggs hatch and turn into larvae. These larvae mature into pupae and then into adults. Just before the young bees emerged from their pupal stage to adulthood, Clare removed them from the foster colonies and brought them into the lab. This way the bees would spend their whole adult life in the lab together, sharing a common environment.

After a week in the lab, Clare tested the aggressiveness of each individual bee. Her test measured aggressive behaviors used by a bee to defend against a rival bee from another colony. Clare observed and counted a range of behaviors including attempts to sting the rival and bites to the rival’s wings and legs. She used these values to calculate an offspring aggression score for each bee.

To select high and low aggression foster colonies to be used in her experiment, Clare first had to identify which colonies were aggressive and which were not. To do this, she put a small amount of a chemical that makes bees aggressive on a piece of paper at the front of the colony entrance. The top two photos show two colony entrances before the chemical. The bottom two photos show the same two colonies 60 seconds after the chemical. The more bees that come out, the more aggressive the colony. You can see from these images that the colony on the right is much more aggressive than the colony on the left. Clare counted the number of bees and used this value to calculate the colony’s aggression score.

Featured scientist: Clare C. Rittschof from the University of Kentucky

Flesch–Kincaid Reading Grade Level = 9.2

SaveSave

SaveSave

SaveSave

Finding Mr. Right

Mountain chickadee, photo by Vladimir Pravosudov

Mountain chickadee, photo by Vladimir Pravosudov

The activities are as follows:

Depending on where they live, animals can face a variety of challenges from the environment. For example, animal species that live in cold environments may have adaptive traits that help them survive and reproduce under those conditions, such as thick fur or a layer of blubber. Animals may also have adaptive behaviors that help them deal with the environment, such as storing food for periods when it is scarce or hibernating during times of the year when living conditions are most unfavorable. These adaptations are usually consistently seen in all individuals within a species. However, sometimes populations of the same species may be exposed to different conditions depending on where they live. The idea that populations of the same species have evolved as a result of certain aspects of their environment is called local adaptation.

Mountain chickadees are small birds that live in the mountains of western North America. These birds do not migrate to warmer locations like many other bird species; they remain in the same location all year long. To deal with living in a harsh environment during the winter, mountain chickadees store large amounts of food throughout the forest during the summer and fall. They eat this food in the winter when very little fresh food is available. There are some populations of the species that live near the tops of mountains, and some that live at lower elevations. Birds at higher elevations experience harsher winter conditions (lower temperature, more snow) compared to birds living at lower elevations. This means that birds higher in the mountains depend more on their stored food to survive winter.

Carrie conducting field research in winter, photo by Vladimir Pravosudov

Carrie conducting field research in winter, photo by Vladimir Pravosudov

Carrie studies mountain chickadees in California. Based on previous research that was done in the lab she works in, she learned these birds have excellent spatial memory, or the ability to recall locations or navigate back to a particular place. This type of memory makes it easier for the mountain chickadees to find the food they stored. Carrie’s lab colleagues previously found that populations of birds from high elevations have much better spatial memory compared to low-elevation birds. Mountain chickadees also display aggressive behaviors and fight to defend resources including territories, food, or mates. Previous work that Carrie and her lab mate conducted found that male birds from low elevations are socially dominant over male birds from high elevations, meaning they are more likely to win in a fight over resources. Taken together, these studies suggest that birds from high elevations would likely do poorly at low elevations due to their lower dominance status, but low-elevation birds would likely do poorly at high elevations with harsher winter conditions due to their inferior memory for finding stored food items. These populations of birds are likely locally adapted – individuals from either population would likely be more successful in their own environments compared to the other.

In this species, females choose which males they will mate with. Males from the same elevation as the females may be best adapted to the location where the female lives. This means that when the female lays her eggs, her offspring will likely inherit traits that are well suited for that environment. If she mates with males that match her environment, she is setting up her offspring to be more successful and have higher survival where they will live. Carrie wondered if female mountain chickadees prefer to mate with males that are from the same elevation and therefor contribute to local adaptation by passing the adaptive behaviors on to the offspring. This process could contribute to the populations becoming more and more distinct. Offspring born in the high mountains will continue to inherit genes for good spatial memory, and those born at low elevations will inherit genes that allow them to be socially dominant.

Mountain chickadee, photo by Vladimir Pravosudov

Mountain chickadee, photo by Vladimir Pravosudov

To test whether female mountain chickadees contribute to local adaptation by choosing and mating with males from their own elevation, Carrie brought high- and low-elevation males and females into the lab. Carrie made sure that the conditions in the lab were similar to the light conditions in the spring when the birds mate (14 hours of light, 10 hours of dark). Once a female was ready, she was given time to spend with both males in a cage that is called a two-choice testing chamber. On one side of the testing chamber was a male from a low-elevation population, and on the other side was a male from a high-elevation population. Each female could fly between the two sides of the testing chamber, allowing her to “choose” which male she preferred to spend time close to (measured in seconds [s]). There was a cardboard divider in the middle of the cage with a small hole cut into it. This allowed the female to sit on the middle of the cardboard, which was not counted as preference for either male. Females from both high- and low-elevation populations were tested in the same way. The female bird’s preference was determined by comparing the amount of time the female spent on either side of the cage. The more time a female spent on the side of the cage near one male, the stronger her preference for that male.

Watch a video of one of the experimental trials:

Featured scientist: Carrie Branch from University of Nevada Reno

Flesch–Kincaid Reading Grade Level = 11.5

Additional teacher resources related to this Data Nugget include:


carrie-branch
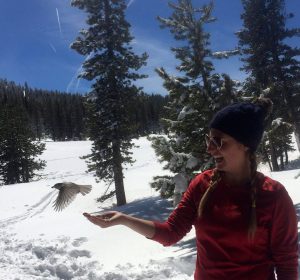
About Carrie: I have been interested in animal behavior and behavioral ecology since my second year in college at the University of Tennessee. I am primarily interested in how variation in ecology and environment affect communication and signaling in birds. I have also studied various types of memory and am interested in how animals learn and use information depending on how their environment varies over space and time. I am currently working on my PhD in Ecology, Evolution, and Conservation Biology at the University of Nevada Reno and once I finish I hope to become a professor at a university so that I can continue to conduct research and teach students about animal behavior. In my spare time I love hiking with my friends and dogs, and watching comedies!

SaveSave

SaveSave

SaveSave

SaveSaveSaveSave

Why so blue? The determinants of color pattern in killifish, Part II

In Part 1, you examined the effects of genetics and environment on anal fin color in male bluefin killifish. The data from Becky’s experiment showed that both genetics and environment work together to determine whether male offspring had blue, yellow, or red anal fins. You will now examine how the father’s genetics, specifically their fin color pattern, affects anal fin color in their sons. When we factor in the genetics of the father, and not just the population he came from, does this influence our interpretation of the data?

The color polymorphism in bluefin killifish – males display anal fins in blue, red, or yellow.

The activities are as follows:

For her experiment, Becky collected male and female fish from both a swamp (26 Mile Bend) and a spring (Wakulla) population. Most of the males in the swamp have blue anal fins, but some have red or yellow. Most of the males from the spring have red or yellow anal fins, but some have blue. Becky decided to add data about the father’s fin color pattern into her existing analysis from Part 1 to see how it affected her interpretation of the results.

In Part 1, Becky was looking at the genetics from the population level. Looking at the data this way, we saw parents from the 26 Mile Bend swamp population were more likely to have sons with blue anal fins than parents from the Wakulla spring. Parents from the 26 Mile Bend were also much more likely to have sons with higher levels of plasticity, meaning they responded more to the environment they were raised in. This means there was a big difference between the proportion sons with blue anal fins in the clear and brown water treatments.

Bringing in the color pattern of the fathers now allows Becky to look at the genetics from both the population and the individual level. From both the swamp and spring population, Becky collected males of all colors. Becky measured the color pattern of the fathers and recorded the color of their anal fins and the rear part of their dorsal fins. She used males that were red on the rear portion of the dorsal fin with a blue anal fin (rb), males that were red on both fins (rr), males that were yellow on both fins (yy), and males that were yellow on the rear portion of the dorsal fin with blue a blue anal fin (yb).

colormorph

She randomly assigned each father’s sons into one of the water treatments, either clear or brown water. Once the sons developed their fin colors, she recorded the anal fin color. This experimental design allowed her to test whether sons responded differently to the treatment depending on the genetics of their father. She thought that the anal fin color of the sons would be inherited genetically from the father, but would also respond plastically to the environment they were raised in. She predicted fathers with blue anal fins would be more likely to have sons with blue anal fins, especially if they were raised in the brown water treatment. She also predicted that fathers with red and yellow anal fins could have sons with blue anal fins if they were raised in the brown water treatment, but not as many as the blue fathers.

Featured scientist: Becky Fuller from The University of Illinois

Flesch–Kincaid Reading Grade Level = 10.9


About Becky: I consider myself to be an evolutionary biologist who studies fishes. I grew up in a small town riding horses in 4-H and working in a veterinary clinic. As an undergraduate at the University of Nebraska at Lincoln, I was interested in biology and considering either medical or veterinary school. Two things led to me research in ecology and evolution. In the summer of 1991, I was taking courses at Cedar Point Biological Field Station which was run by the University of Nebraska. I met Dr. Anthony Joern (Tony) who was studying grasshopper community ecology. Tony hired me onto his field crew that summer after the courses were finished. I went on to do an undergraduate thesis under Tony’s mentorship where I studied predation on grasshoppers. I caught the “science bug” and never looked back. Following my undergraduate work, I went to Uppsala University in Sweden on a Fulbright Scholarship. Here, I developed my love for fish and aquatics. I worked with Dr. Anders Berglund on pipefish in a fjord on the west coast of Sweden. Since then, I have had many wonderful advisers, instructors, mentors, and collaborators who have helped me develop skills along the numerous fronts required for a successful career in science. I consider myself very fortunate to have a job where I can do science and teach young, enthusiastic undergraduates.

Why so blue? The determinants of color pattern in killifish, Part I

The color polymorphism in bluefin killifish – males display anal fins in blue, red, or yellow.

The activities are as follows:

In nature, animals can be found in a dazzling display of different colors and patterns. Color patterns serve as signals to members of the animal’s own species, or to other species. They can be used to attract mates, camouflage with the environment, or warn predators to stay away. When looking at the diversity of colors found in nature, you may wonder, why do animals have the color patterns they do? One way to study this question is to look at a single species that has individuals of different colors. This variation can be used to uncover the mechanisms that determine color.

The bluefin killifish is a freshwater species that is found mostly in Florida. They are found in two main habitats, springs and swamps. An intriguing aspect of this species is that male bluefin killifish are brightly colored with many different color patterns. The brightest part of the fish is the anal fin, which is found on the bottom of the fish by the tail. Some males have red anal fins, some have yellow anal fins, and others have blue anal fins. This variation in color is called a polymorphism, meaning that in a species there are multiple forms of a single trait. In a single spring or swamp you may see all three colors!

Becky in the field, with her colleague Katy, collecting fish in 26 Mile Bend Swamp.

Becky in the field, with her colleague Katy, collecting fish in 26 Mile Bend Swamp.

Becky is a biologist studying bluefin killifish. One day, while out snorkeling for her research, she noticed an interesting pattern. She observed that there were differences in the polymorphism depending on whether she was in a spring or swamp. Springs have crystal clear water that can appear blue-tinted. Becky noticed that most of the males in springs had either red or yellow anal fins. Swamps have brown water, the color of iced tea, due to the dissolved plant materials in the water. Becky noticed that most of the males in swamps had blue anal fins. After noticing this pattern she wanted to find out why this variation in color existed. Becky came up with two possible explanations. She thought males in swamps might be more likely to be blue (1) because of the genes they inherit from their parents, or (2) because individual color is responding to environmental conditions. This second case, where the expression of a trait is directly influenced by the environment that an individual experiences, is known as phenotypic plasticity.

Becky had to design an experiment that could tease apart whether genes, plasticity, or both were responsible for male anal fin color. She did this by collecting male and female fish from the two habitat types, breeding them, and raising their offspring in clear or brown water. If a father’s genes are responsible for anal fin color in their sons, then fathers from swamps would be more likely to leave behind blue sons. If environmental conditions determine the color of sons, then sons raised in brown water will be blue, regardless of the population origin of their father.

Becky’s family helping her out in the field!

Becky’s family helping her out in the field!

Becky and her colleagues collected fish from two populations in the wild – Wakulla Spring, and 26 Mile Bend Swamp – and brought them into the lab. These two populations represent the genetic stocks for the experiment. Fish from Wakulla are more closely related to each other than they are to fish from 26 Mile Bend. In the lab, they mated female fish with male fish from the same population: females from Wakulla mated with males from Wakulla, and females from 26 MB mated with males from 26 MB. The female fish then laid eggs, and after the offspring hatched from their eggs, half were put into tanks with clear water (which mimics spring conditions) and half in tanks with brown water (which mimics swamp conditions). For the brown water treatment, Becky colored the water using ‘Instant, De-caffeinated, No-Sugar, No-Lemon’ tea. They raised the fish to adulthood (3-6 months) so they could determine their sex and the color of the son’s anal fins. Becky then counted the total number of male offspring, and the number of male offspring that had blue anal fins. She used these numbers to calculate the proportion of sons that had blue anal fins in each treatment.

Featured scientist: Becky Fuller from The University of Illinois

Flesch–Kincaid Reading Grade Level = 9.4

To introduce students to bluefin killifish, there is a video showing the blue and red color morphs. Video can be shown on mute (background music is a little corny)!


About Becky: I consider myself to be an evolutionary biologist who studies fishes. I grew up in a small town riding horses in 4-H and working in a veterinary clinic. As an undergraduate at the University of Nebraska at Lincoln, I was interested in biology and considering either medical or veterinary school. Two things led to me research in ecology and evolution. In the summer of 1991, I was taking courses at Cedar Point Biological Field Station which was run by the University of Nebraska. I met Dr. Anthony Joern (Tony) who was studying grasshopper community ecology. Tony hired me onto his field crew that summer after the courses were finished. I went on to do an undergraduate thesis under Tony’s mentorship where I studied predation on grasshoppers. I caught the “science bug” and never looked back. Following my undergraduate work, I went to Uppsala University in Sweden on a Fulbright Scholarship. Here, I developed my love for fish and aquatics. I worked with Dr. Anders Berglund on pipefish in a fjord on the west coast of Sweden. Since then, I have had many wonderful advisers, instructors, mentors, and collaborators who have helped me develop skills along the numerous fronts required for a successful career in science. I consider myself very fortunate to have a job where I can do science and teach young, enthusiastic undergraduates.

SaveSave

SaveSave

Winter is coming! Can you handle the freeze?

Doug, and two members of his team, setting up the reciprocal transplant experiment in Scandinavia.

Doug with the reciprocal transplant experiment in Scandinavia.

The activities are as follows:

Doug is a biologist who studies plants from around the world. He often jokes that he chose to work with plants because he likes to take it easy. While animals rarely stay in the same place and are hard to catch, plants stay put and are always growing exactly where you planted them! Using plants allows Doug to do some pretty cool and challenging experiments. Doug and his research team carry out experiments with the plant species Mouse-ear Cress, or Arabidopsis thaliana. They like this species because it is easy to grow in both the lab and field. Arabidopsis is very small and lives for just one year. It grows across most of the globe across a wide range of latitudes and climates. Arabidopsis is also able to pollinate itself and produce many seeds, making it possible for researchers to grow many individuals to use in their experiments.

Doug, and two members of his team, setting up the reciprocal transplant experiment in Scandinavia.

Doug, and two members of his team, setting up the reciprocal transplant experiment in Scandinavia.

Part I: Doug wanted to study how Arabidopsis is able to survive in such a range of climates. Depending on where they live, each population faces its own challenges. For example, there are some populations of this species growing in very cold habitats, and some populations growing in very warm habitats. He thought that each of these populations would adapt to their local environments. An Arabidopsis population growing in cold temperatures for many generations may evolve traits that increase survival and reproduction in cold temperatures. However, a population that lives in warm temperatures would not normally be exposed to cold temperatures, so the plants from that population would not be able to adapt to cold temperatures. The idea that populations of the same species have evolved as a result of certain aspects of their environment is called local adaptation.

To test whether Arabidopsis is locally adapted to its environment, Doug established a reciprocal transplant experiment. In this type of experiment, scientists collect seeds from plants in two different locations and then plant them back into the same location (home) and the other location (away). For example, seeds from population A would be planted back into location A (home), but also planted into location B (away). Seeds from population B would be planted back into location B (home), but also planted at location A (away). If populations A and B are locally adapted, this means that A will survive better than B in location A, and B will survive better than A in location B. Because each population would be adapted to the conditions from their original location, they would outperform the plants from away when they are at home (“home team advantage”).

In this experiment, Doug collected many seeds from warm Mediterranean locations at low latitudes, and cold Scandinavian locations at high latitudes. He used these seeds to grow thousands of seedlings. Once these young plants were big enough, they were planted into a reciprocal transplant experiment. Seedlings from the Mediterranean location were planted alongside Scandinavian seedlings in a field plot in Scandinavia. Similarly, seedlings from the Scandinavian locations were planted alongside Mediterranean seedlings in a field plot in the Mediterranean. By planting both Mediterranean and Scandinavian seedlings in each field plot, Doug can compare the relative survival of each population in each location. Doug made two local adaptation predictions:

  1. Scandinavian seedlings would survive better than Mediterranean seedlings at the Scandinavian field plot.
  2. Mediterranean seedlings would survive better than Scandinavian seedlings planted at the Mediterranean field plot.

Doug's team in the Mediterranean prepped and ready to set up the experiment.

Doug’s team in the Mediterranean prepped and ready to set up the experiment.

Part II: The data from Doug’s reciprocal transplant experiment show that the Arabidopsis populations are locally adapted to their home locations. Now that Doug confirmed that populations were locally adapted, he wanted to know how it happened. What is different about the two habitats? What traits of Arabidopsis are different between these two populations? Doug now wanted to figure out the mechanism causing the patterns he observed.

Doug originally chose Arabidopsis populations in Scandinavia and the Mediterranean for his research on local adaptation because those two locations have very different climates. The populations may have adapted to have the highest survival and reproduction based on the climate of their home location. To deal with sudden freezes and cold winters in Scandinavia, plants may have adaptations to help them cope. Some plants are able to protect themselves from freezing temperatures by producing chemicals that act like antifreeze. These chemicals accumulate in their tissues to keep the water from turning into ice and forming crystals. Doug thought that the Scandinavian population might have evolved traits that would allow the plants to survive the colder conditions. However, the plants from the Mediterranean aren’t normally exposed to cold temperatures, so they wouldn’t have necessarily evolved freeze tolerance traits.

To see whether freeze tolerance was driving local adaptation, he set up an experiment to identify which plants survived after freezing. Doug again collected seeds from several different populations across Scandinavia and across the Mediterranean. He chose locations that had different latitudes because latitude affects how cold an area gets over the year. High latitudes (closer to the poles) are generally colder and low latitudes (closer to the equator) are generally warmer. Doug grew more seedlings for this experiment, and then, when they were a few days old, he put them in a freezer. Doug counted how many seedlings froze to death, and how many survived, and he used these numbers to calculate the percent survival for each population. To gain confidence in his results, he did this experiment with three replicate genotypes per population.

Doug predicted that if freeze tolerance was a trait driving local adaptation, the seedlings originally from colder latitudes (Scandinavia) would have increased survival after the freeze. Seedlings originally from lower latitudes would have decreased survival after the freeze because the populations would not have evolved tolerance to such cold temperatures.

Featured scientist: Doug Schemske from Michigan State University (MSU). Written by Christopher Oakley from MSU and Purdue University, and Marty Buehler (RET) from Hastings High School.

Flesch–Kincaid Reading Grade Level = 12.0

There is one scientific paper associated with the data in this Data Nugget. The citation and PDF of the paper is below.

Agren, J. and D.W. Schemske (2012). Reciprocal transplants demonstrate strong adaptive differentiation of the model organism Arabidopsis thaliana in its native range. New Phytologist 194:1112–1122.

Gene expression in stem cells

Adam working in the lab at Colorado State University.

Adam working in the lab at Colorado State University.

The activities are as follows:

Every cell in your body contains the same DNA. How is it that genetically identical skin, brain, and muscle cells can look very different and perform very different functions from each other? Cells differentiate, or become different from one another, by turning certain genes on and off. This process is called gene expression. For example, when you spend time in the sun your skin cells turn on the gene for pigment, which protects your cells from bright sunlight. In the winter when there is less sunlight, your cells turn off this gene. This process your body uses to turn genes on and off is the same one it uses to develop from one cell into the many different cell types that make up your body. Stem cells have the ability to turn into any other type of cell in the body, an ability known as pluripotency. Your body retains some stem cells for your entire life.

Some genes are only turned on in specific types of cells because they have specialized jobs for those cell types, like muscle or brain cells. Other genes are more like managers, controlling which genes are turned on and off. The activity of these manager genes may be more common in stem cells because they could control which type of cell the stem cell will become. In recent years, scientists discovered they could reprogram specialized cells back into non-specialized stem cells, simply by turning on several manager genes. They call these reprogrammed cells induced pluripotent, or iPS.

Adam working under the hood, reprogramming specialized cells into induced pluripotent stem cells for his experiments.

Adam working under the hood, reprogramming specialized cells into induced pluripotent stem cells for his experiments.

Adam was working as a biologist in Colorado when he learned that many cool medical advances in regenerative and personalized medicine will happen when we figure out which genes are turned on, and which are turned off, in pluripotent stem cells. In his research, Adam wanted to look at gene expression for two genetically identical cell lines, those that have specialized and those that have been reprogrammed to be iPS stem cells. He was interested to see which genes are expressed by both types of cells and which genes are only expressed in one type of cell.

He decided to work with fibroblast cells because they are easy to grow in the lab. Fibroblasts cells are mainly responsible for production and maintenance of the extracellular matrix (including joints, ligaments, tendons and connective tissues), which is critical in holding the body’s tissues together. From reading the work of other scientists, Adam learned how to transform fibroblast cells into iPS stem cells. This knowledge lead him to two genetically identical types of cells – (1) specialized fibroblast cells and (2) unspecialized iPS cells. When fibroblast cells are transformed into unspecialized iPS cells, their function changes and they become responsible for wound healing and generating new tissues, acting like a reserve set of cells. Because fibroblast and iPS cells perform very different functions, Adam thinks it is likely that each cell line will expresses genes that are specific to its individual function.

Adam looked at expression in 10 different genes that are thought to have important functions for fibroblast or iPS cells. Adam measured the expression for each gene by looking at RNA abundance of each gene in the different cell types. RNA is the intermediate between DNA (the genetic blueprint) and protein (the functional worker of the cell). Adam chose to look at RNA, because it is often representative of how much protein is present in a cell, which is very difficult to measure directly. Adam analyzed three replicates for each cell type. He replicated in order to get a more accurate representation for each cell type. This is important in case the samples were in slightly different conditions, like warmer or cooler temperatures, which could alter gene expression. This experiment allowed Adam to figure out which genes are turned on in iPS cells, allowing him to better understand how stem cells work.

iPS cells display different gene expression and physical appearance than HFF cells: Figures A and B are low magnification images of two different iPS cell colonies. iPS cells are usually small, round, and like to grow in circular-like colonies. Figures C is a low magnification image of HFF cells. HFF cells tend to appear long and slender almost like trees. Generally, HFF cells like to grow near each other, but not in colonies. Figure D is a higher magnification image of the black box in figure C, showing a group of HFF cells growing in close proximity with each other.

iPS cells display different gene expression and physical appearance than HFF cells: Figures A and B are low magnification images of two different iPS cell colonies. iPS cells are usually small, round, and like to grow in circular-like colonies. Figures C is a low magnification image of HFF cells. HFF cells tend to appear long and slender almost like trees. Generally, HFF cells like to grow near each other, but not in colonies. Figure D is a higher magnification image of the black box in figure C, showing a group of HFF cells growing in close proximity with each other.

Featured scientist: Adam Heck from Colorado State University. Written with Sandra Weeks from the Poudre Valley School District.

Flesch–Kincaid Reading Grade Level = 10.6

The gene expression data found in this activity was gathered from the following paper – citation and link below:

Salmon in hot water

Chinook salmon in Alaska.

The activities are as follows:

Pacific salmon are important members of freshwater and ocean food webs. Salmon transport nutrients from the ocean to freshwater habitats, and traces of these nutrients can be found in everything from trees to bears! Salmon also support sport and commercial fisheries, and are used for ceremonial purposes by Native Americans. Climate change poses a threat to salmon populations by warming the waters of streams and rivers where they reproduce. To maintain healthy populations, salmon rely on cold, freshwater habitats and may go extinct as temperatures rise in coming decades. Warm temperatures can cause large salmon die-offs. However, some salmon individuals have higher thermal tolerance and are better able to survive when water temperatures rise.

Eggs used in QTL experiment

Eggs used in QTL experiment

Salmon individuals and populations may be better able to survive in warmer waters because they have certain gene variants that help them survive under these conditions. Scientists want to know whether there is a genetic basis for the variation observed in salmon’s thermal tolerance. If differences in certain genes control variation in thermal tolerance, scientists can identify the location on the genome responsible for this very important adaptation. Once identified, management agencies could then screen for these genes in populations of salmon in order to identify individuals that could better survive in a future warmer environment. Hatchery programs could also breed thermally tolerant fish in an attempt to preserve this important fish species.

Scientists working in the lab

Scientists working in the lab

To identify the genes responsible for a particular trait, scientists look for Quantitative Trait Loci (QTL). A QTL is a genetic variant that influences the phenotype of a polygenic trait, such as human height or skin color, and perhaps thermal tolerance in salmon. Scientists can find QTL by conducting experimental mattings then examining the phenotypic and genetic characteristics of the offspring. In this study, parent fish from one population of salmon, some that are tolerant to warm water and some that are not, mated and produced offspring. These offspring now had a mix of genetic backgrounds from their parents, meaning that some offspring inherited genetic variants that made them more tolerant to high temperatures and some did not. Each offspring was tested for their thermal tolerances, and had their genomes sequenced. Differences in the genome between offspring that are tolerant and those that are not reveal areas of the genome that are correlated with thermal tolerance and survival in warm water. If differences in certain genes control variation in thermal tolerance, the scientists predicted they could find regions in the salmon genome that are correlated with survival in warm water.

Featured scientists: Wesley Larson, Meredith Everett, and Jim Seeb from the University of Washington

Flesch–Kincaid Reading Grade Level = 10.9

There are two scientific papers associated with the data in this Data Nugget. The citations and PDFs of the papers are below. The lab webpage can be found here.

Check out these Stated Clearly videos to explore DNA and genes with students!

SaveSave

SaveSave

SaveSave