The activities are as follows:
- Teacher Guide
- Student activity, Graph Type A, Level 3
- Student activity, Graph Type B, Level 3
- Student activity, Graph Type C, Level 3
- PowerPoint of images
- Grading Rubric
- Digital Data Nugget on DataClassroom
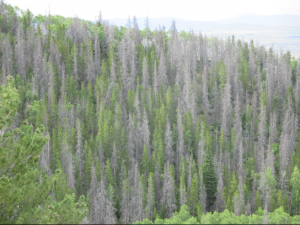
El Niño events happen every 5 to 10 years and take place in the Pacific Ocean. El Niño occurs when the winds that blow west over the equator temporarily weaken, and even switch direction. This allows warm surface waters that typically pile up on the western side of the Pacific Ocean to flow to the east. In South America, El Niño brings heavy rains and floods because the warm water moves toward that continent. On the other hand, the warm water moves away from the continent of Australia, causing drought. In the U.S., warm waters travel up to California during El Niño years, causing the ocean to be much warmer than usual. El Niño’s effects are so strong that it even changes the marine animals that live off the California coast in those years!
Laura’s first experience with El Niño came when she was growing up in California. A strong El Niño event hit in 1997-98, and many cities in California flooded because of heavy rainstorms. The event even made the national news on TV! Laura’s second El Niño experience came in 2015, the year she started training to become a scientist. These events had such a big impact on her that she decided to study how zooplankton in the ocean are affected by El Niño. Zooplankton are tiny drifting ocean animals (“zoo” = animal + “plankton” = drifter) that eat phytoplankton (“plant drifters”). Zooplankton are important for the ocean’s food web because they are food for fish, whales, and seabirds.
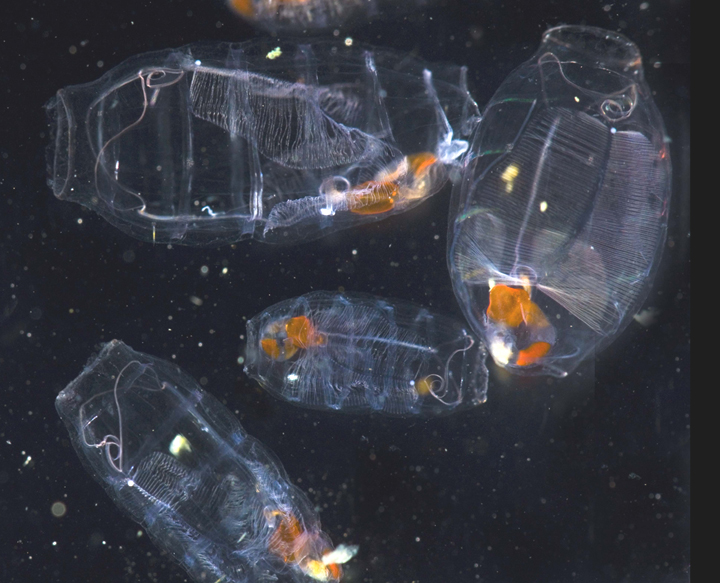
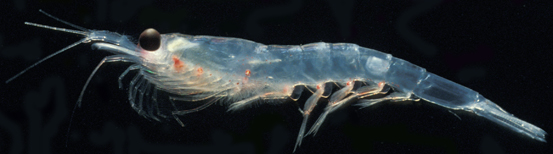
Zooplankton come in many shapes, sizes, and species. The two main groups are crustaceans and gelatinous animals. Crustaceans look like small shrimp and crabs, with hard, crunchy shells and segmented legs like insects. In contrast, gelatinous animals are watery and squishy, like jellyfish. Laura wanted to know how El Niño events might affect which group of zooplankton are found off the coast of California.
Warm ocean waters during El Niño events have lower nutrient levels, so fewer phytoplankton grow leading to less food available for zooplankton. Gelatinous animals can survive in areas of the ocean where there is less food available. They are also able to live in warmer water than crustaceans. For these two reasons, Laura though that gelatinous animals may be able to live in the warmer water off California during El Niño events. Laura predicted that during the El Niño events of 1992-93, 1997-98, and 2015-16, the balance would shift in favor of gelatinous animals over crustaceans
To test her idea, Laura used a long-term dataset that documents zooplankton collected offshore of southern California since 1951. Every spring, a ship goes out on the ocean and tows plankton nets for 30 minutes at 40 different locations. The ship brings back jars full of zooplankton. Scientists look at samples from those jars and identify the species and measure the lengths of each individual zooplankton in the sample. They then add up all the lengths of individual plankton to get the total biomass of each group. Biomass is similar to weight and shows us how big each animal is and how much space their group takes up. Scientists also measure water temperature and how much phytoplankton is found. The amount of phytoplankton is measured by detecting chlorophyll in the water. Chlorophyll from phytoplankton is a measure of how much food is available to zooplankton.
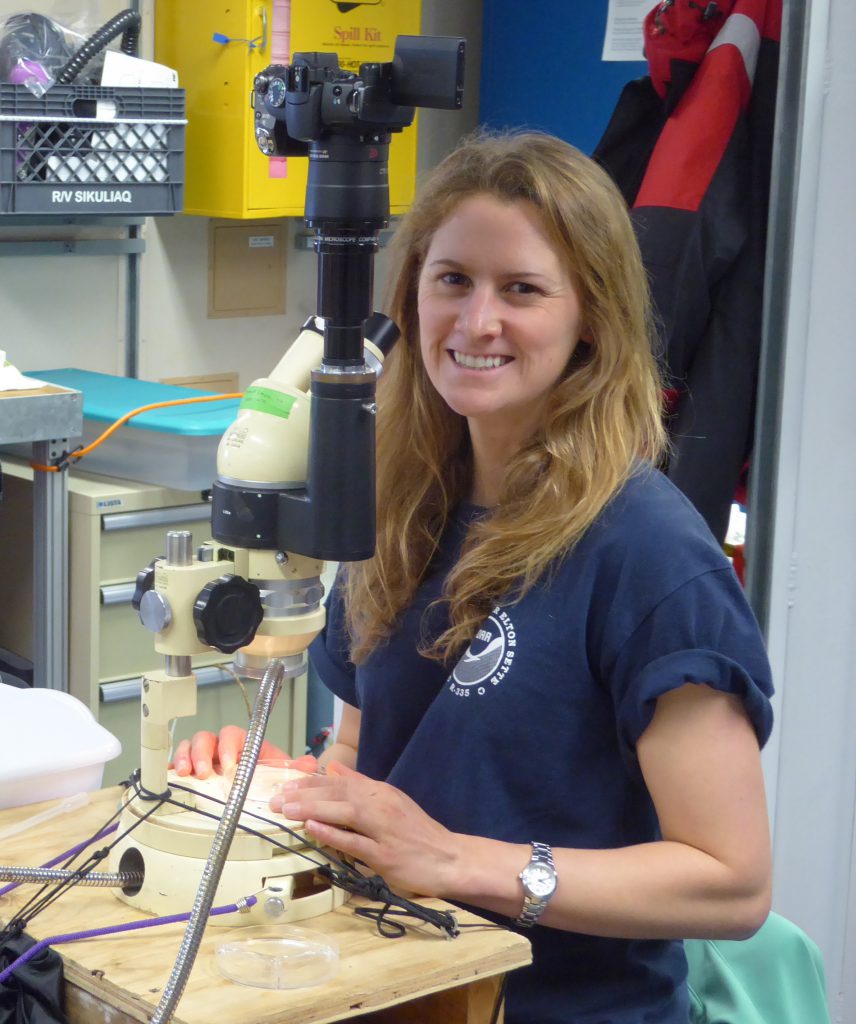
Featured scientist: Laura Lilly from Scripps Institution of Oceanography, UC San Diego