![]()
This post is by MSU postdocs Liz Schultheis and Melissa Kjelvik. See the original article on the BEACON webpage (reproduced below):
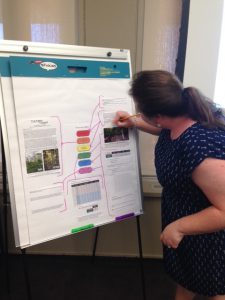
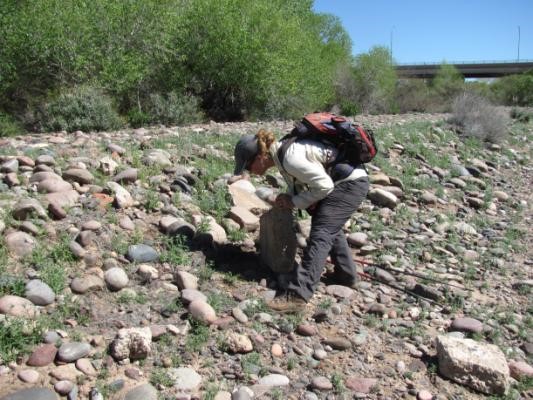
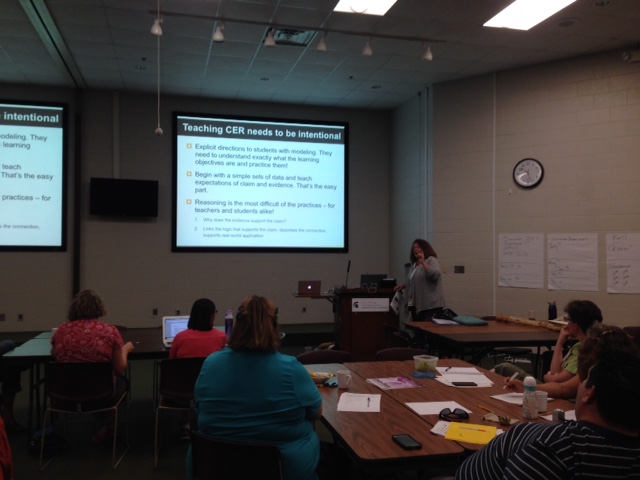
Liz modeling the process of science within a Data Nugget.
Back when we were biology graduate students, the GK-12 program at the Kellogg Biological Station (KBS) exposed us to science education for the first time. When we signed up to work with K-12 teachers and go into schools as the “classroom scientist” we knew there would be benefits, such as time to hone our science communication skills, a venue to share our research with broad audiences, and of course saving us the hour and a half drive to MSU’s main campus to TA. However, we had no idea what we had really gotten ourselves into.
We were each assigned a partner teacher whose classroom we would visit a few times a week, and who would mentor us as we attempted to share our research with students for the first time. The experience of standing up in front of 30 sixth graders was intimidating at first. Yet, it was necessary to realize how hard it was to simplify and explain a topic, while also making it engaging for an audience who may never have thought about these ideas before. The teachers’ infectious enthusiasm boosted the passion we had for our research. They pushed us to describe why the things we were doing day-to-day mattered for the big picture. They were willing to stand in the back of the classroom and wave their arms when students checked out because we’d used too much jargon or started to nerd-out. These teachers had such a clear passion for improving student learning; they constantly stepped out of their comfort zone to try new ways to improve their teaching and integrate the latest effective science teaching strategies into their classrooms. Working with these teachers and their students quickly became our favorite time of the week.
These same teachers originally inspired Data Nuggets; they shared that their students were struggling to make sense of data in most applications, but especially data from classroom inquiry projects that turned out messy or did not follow predictions. Students should not feel they have failed when their data has variation around the mean or does not support their hypothesis. Typically, students are only exposed to research and data published in textbooks, leading to the misconception that all science is a completed product with well established ideas and clear results. To get students to think like scientists, they need to be exposed to the process of science itself and how scientists work to develop, test, and refine their ideas. As early-career scientists, we knew that along the way, experiments often fail or yield unexpected results.
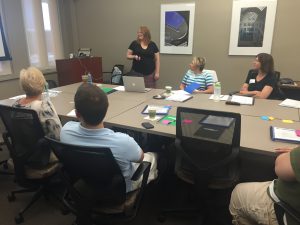
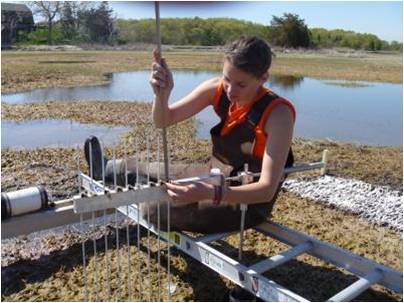
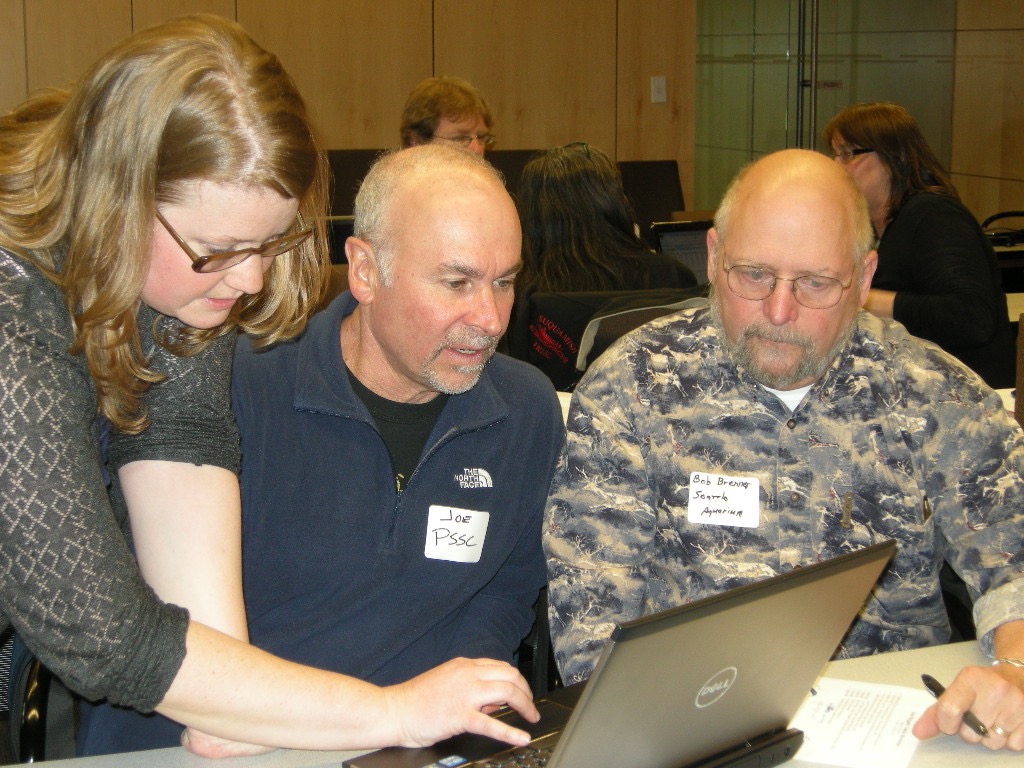
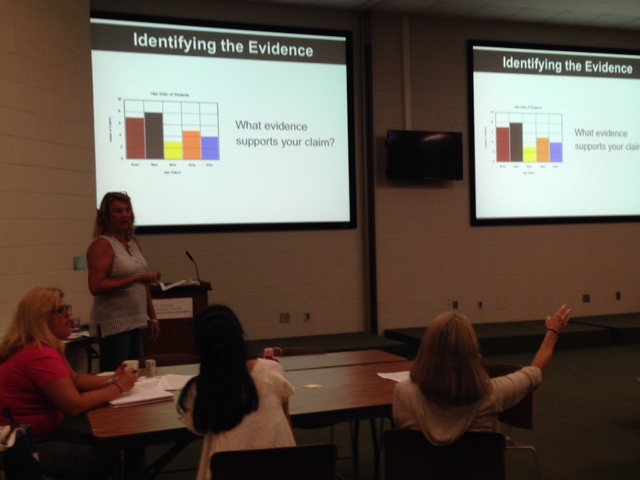
Melissa running a professional development workshop for high school math and science teachers.
For continued support, we turned to BEACON, whose education objectives align with the Data Nuggets vision. Using these seed funds, we were able to work with Louise Mead and other BEACON scientists to develop Data Nuggets that connect students to real data and the motivation and passion of the scientists behind the research. Today we have 46 Data Nuggets (and counting) up on our website, freely available to teachers and students, many written by women and early career scientists.
As we wrapped up as graduate students, we realized there was so much more we wanted to do to improve and expand Data Nuggets. The support from BEACON allowed us time to fully develop our ideas and submit an NSF DRK-12 grant with Louise. As BEACON postdocs we are excited to have time to integrate all these great ideas into Data Nuggets. The main objective of the collaborative NSF DRK-12 grant, between MSU and Biological Science Curriculum Study (BSCS), is to assess whether Data Nuggets increase students’ quantitative reasoning abilities, along with their understanding of, and engagement with, science. In preparation for this efficacy study, we are currently revising each Data Nugget and integrating new ideas and feedback from our collaboration.
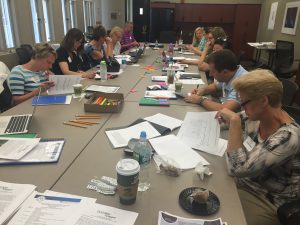
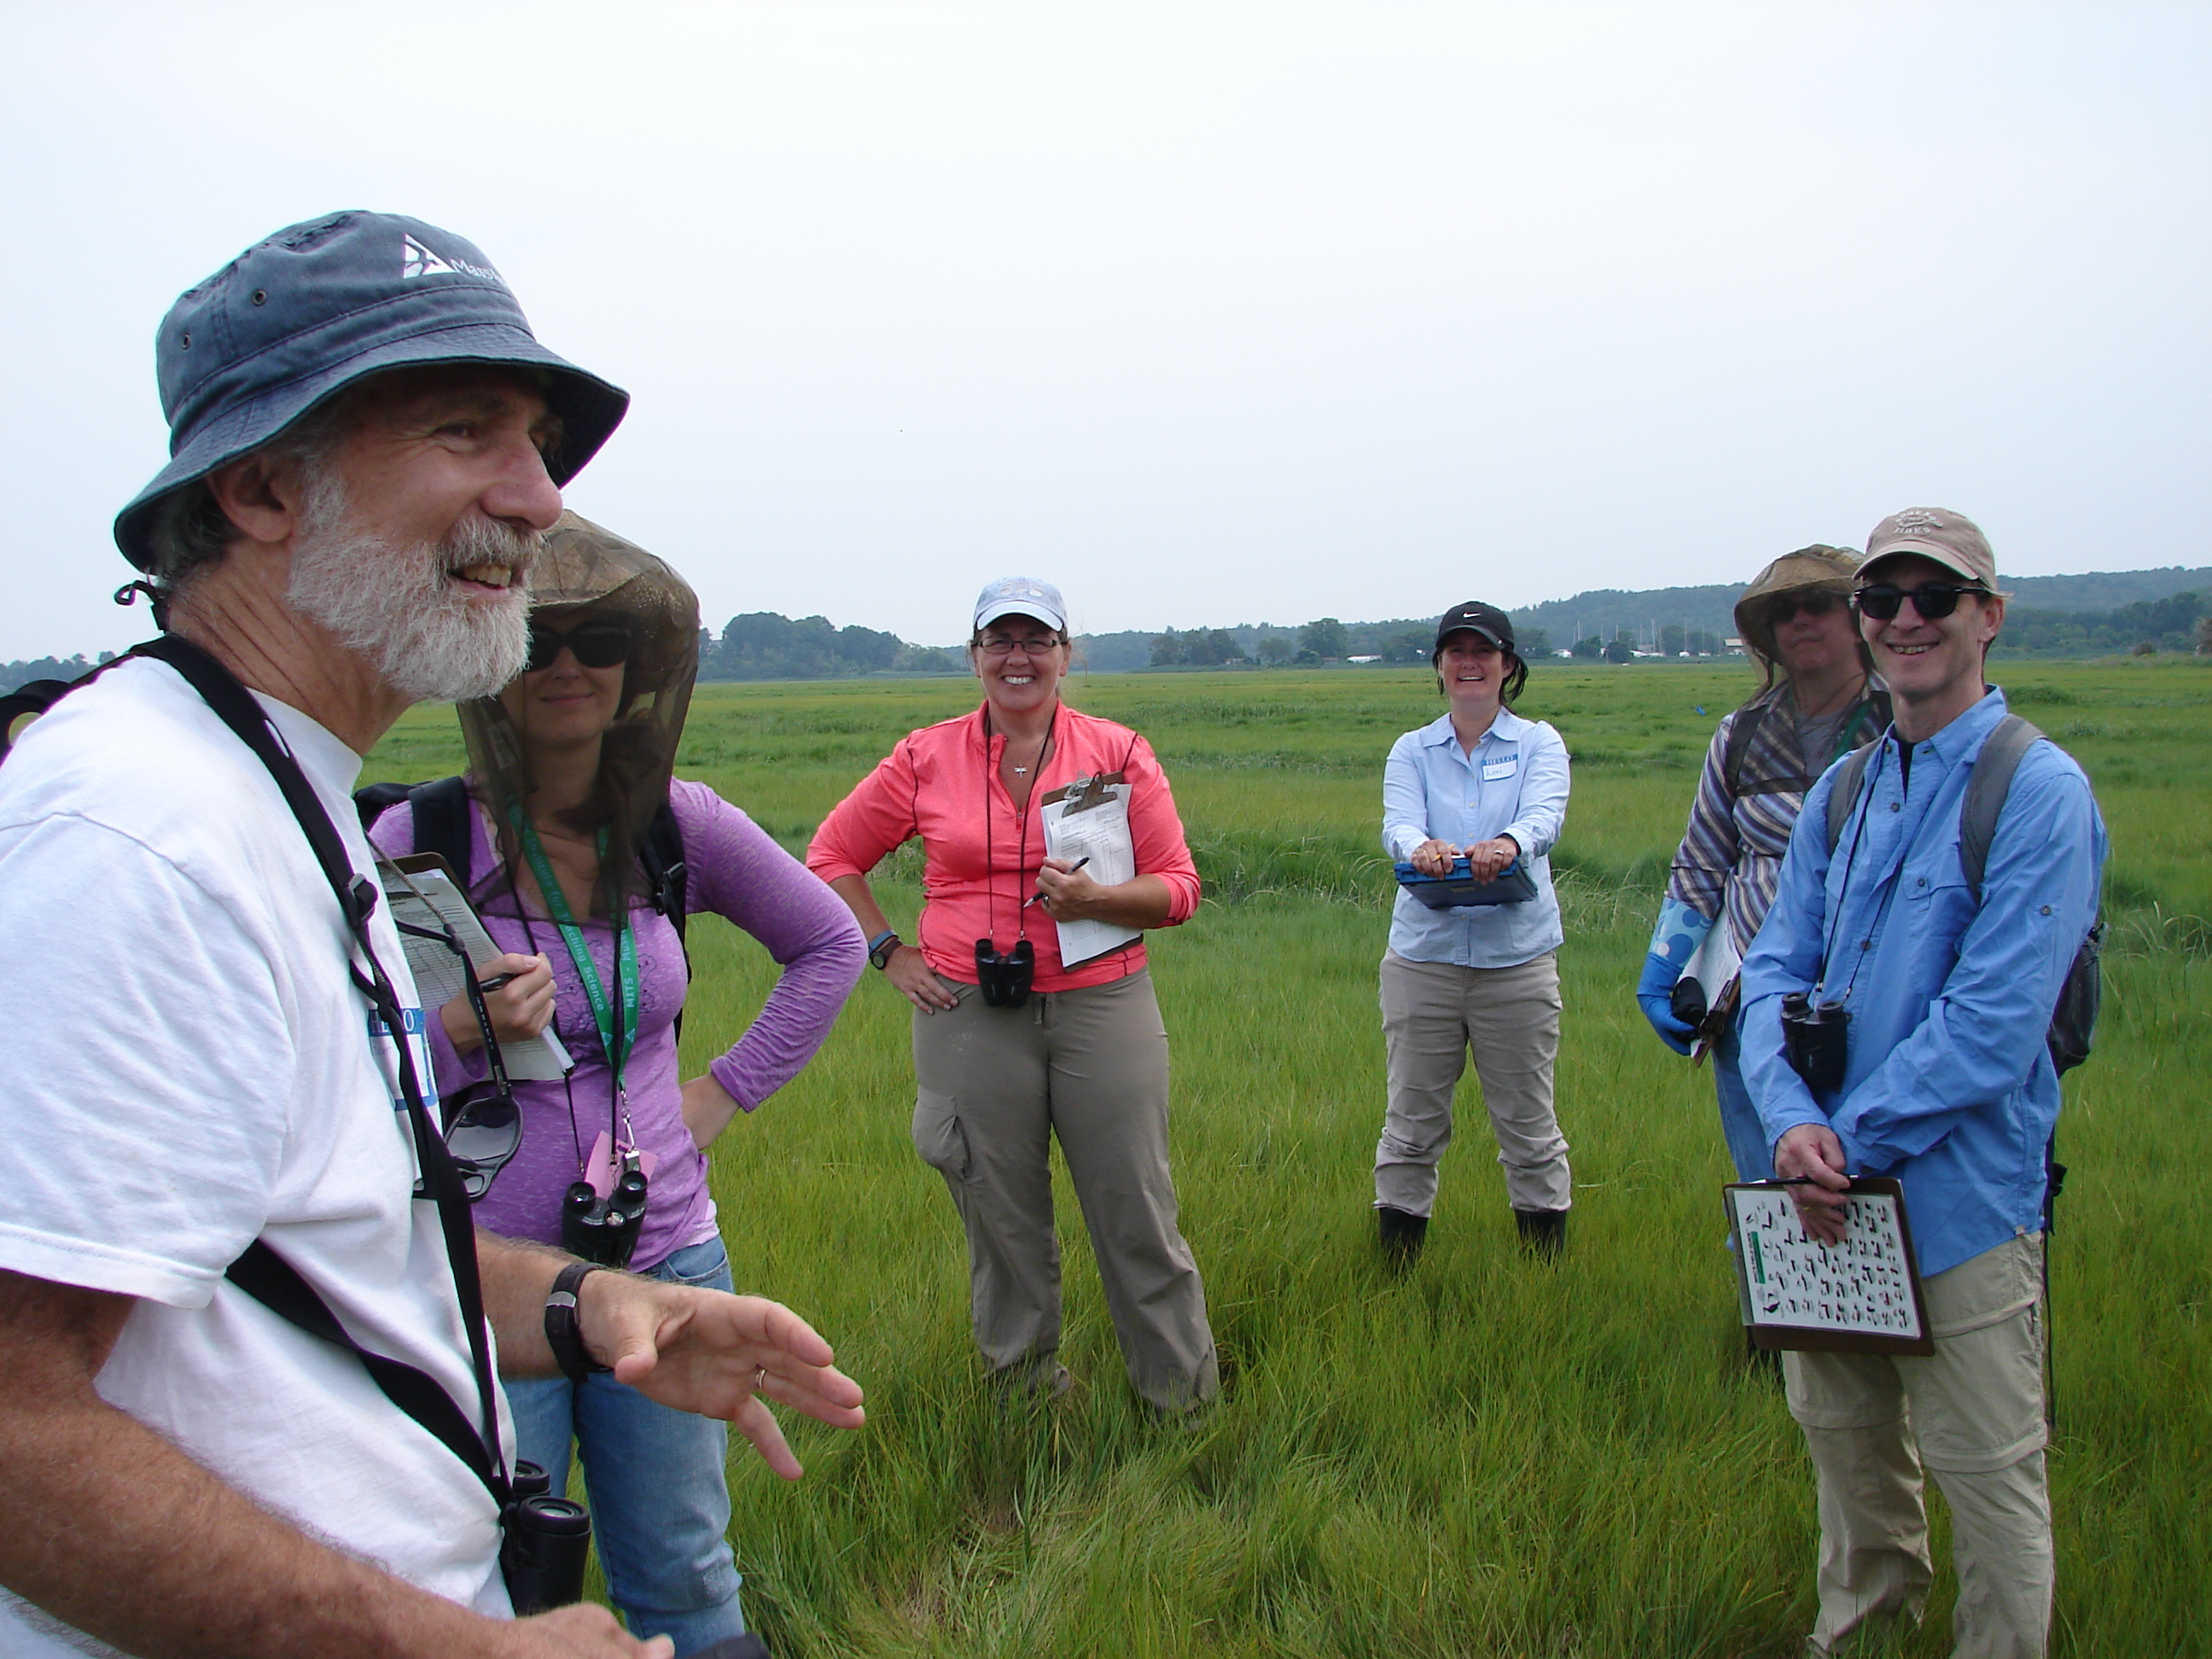
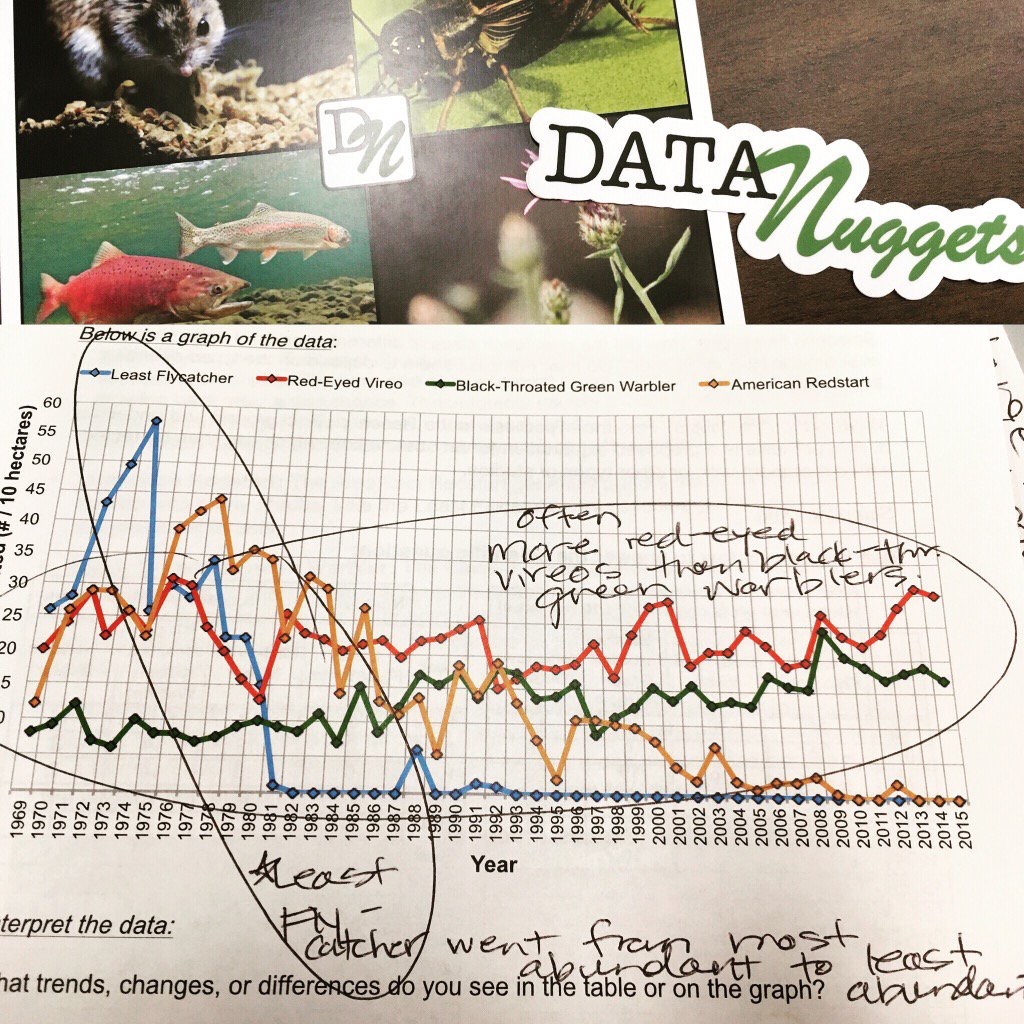
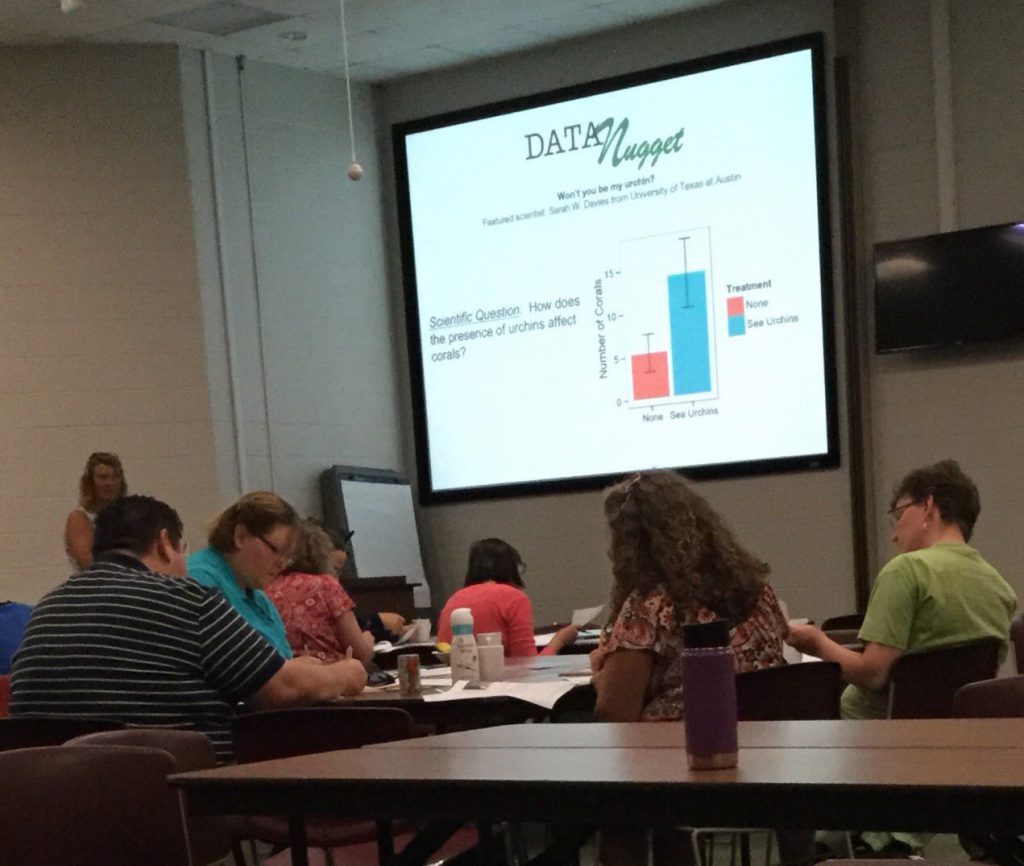
High school math and science teachers working to complete a Data Nugget during a professional development workshop.
This summer we worked with 4 teachers – Marcia Angle, Cheryl Hach, Ellie Hodges, and Kristy Campbell. Marcia and Cheryl have been with us since the beginning, and were among those who first helped us develop Data Nuggets. They were thrilled to see that we continued to develop Data Nuggets and were happy with how far they’d come since the original inception. This summer we had many insightful conversations about students’ struggles with certain scientific practices, including data interpretation and constructing explanations. The teachers shared their different teaching strategies, and researched new ones, in order to write guides to help other teachers cover these difficult topics. As a group we read through student responses to Data Nuggets piloted in the spring. This was a powerful way to think deeply about the areas students could improve, and ways for us to provide more context in our teacher guides to encourage rich classroom discussions. Along with BEACON postdoc Alexa Warwick, the teachers developed a grading rubric to help teachers score Data Nuggets and identify areas where their students need more practice. While reading student responses, the teachers collectively noticed that students had a difficult time using evidence to support their claims, so they worked on a new tool to ease students into this process. They presented this tool, along with other strategies, at professional development workshops for the KBS K-12 partnership teachers and all Kalamazoo Public Schools high school science teachers.
This year we are finalizing preparations for our Data Nugget efficacy study, taking place in 2017. Preliminary observations in classrooms, and feedback from teachers, indicate Data Nuggets effectively increase students’ quantitative and scientific literacy while engaging them with the story behind the research and building a connection to scientists. However, as scientists, we are of course not satisfied with anecdotal evidence and want data to support our claims! We are excited for the upcoming study to determine the ways in which Data Nuggets might contribute to a strong science education curriculum!
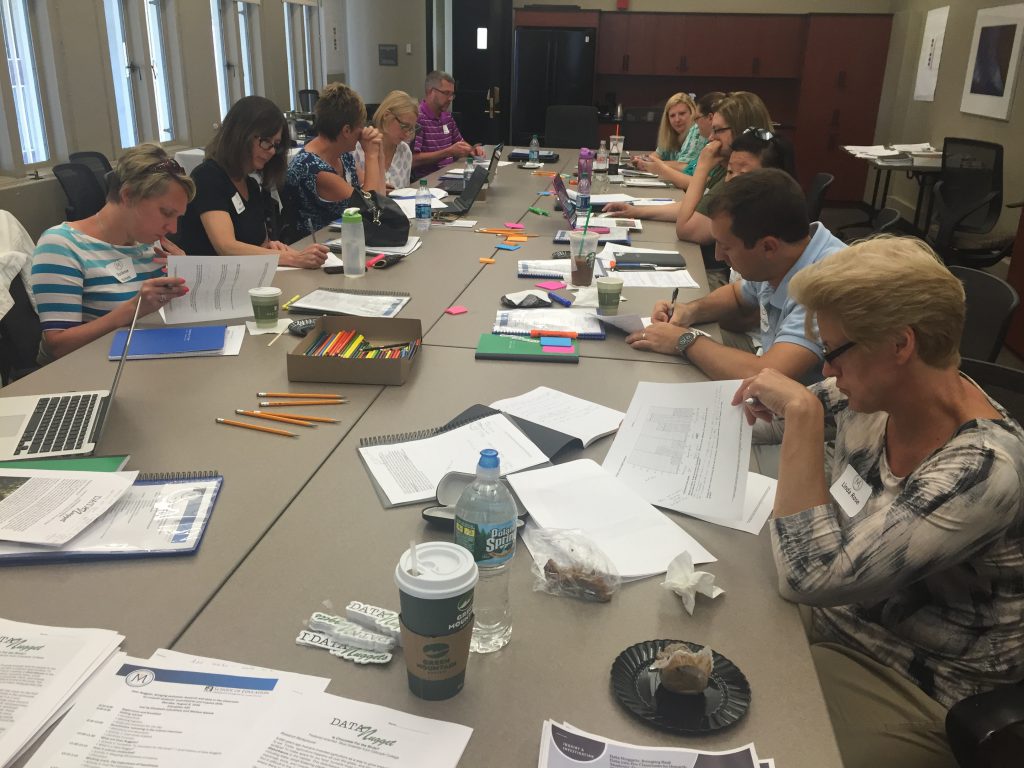

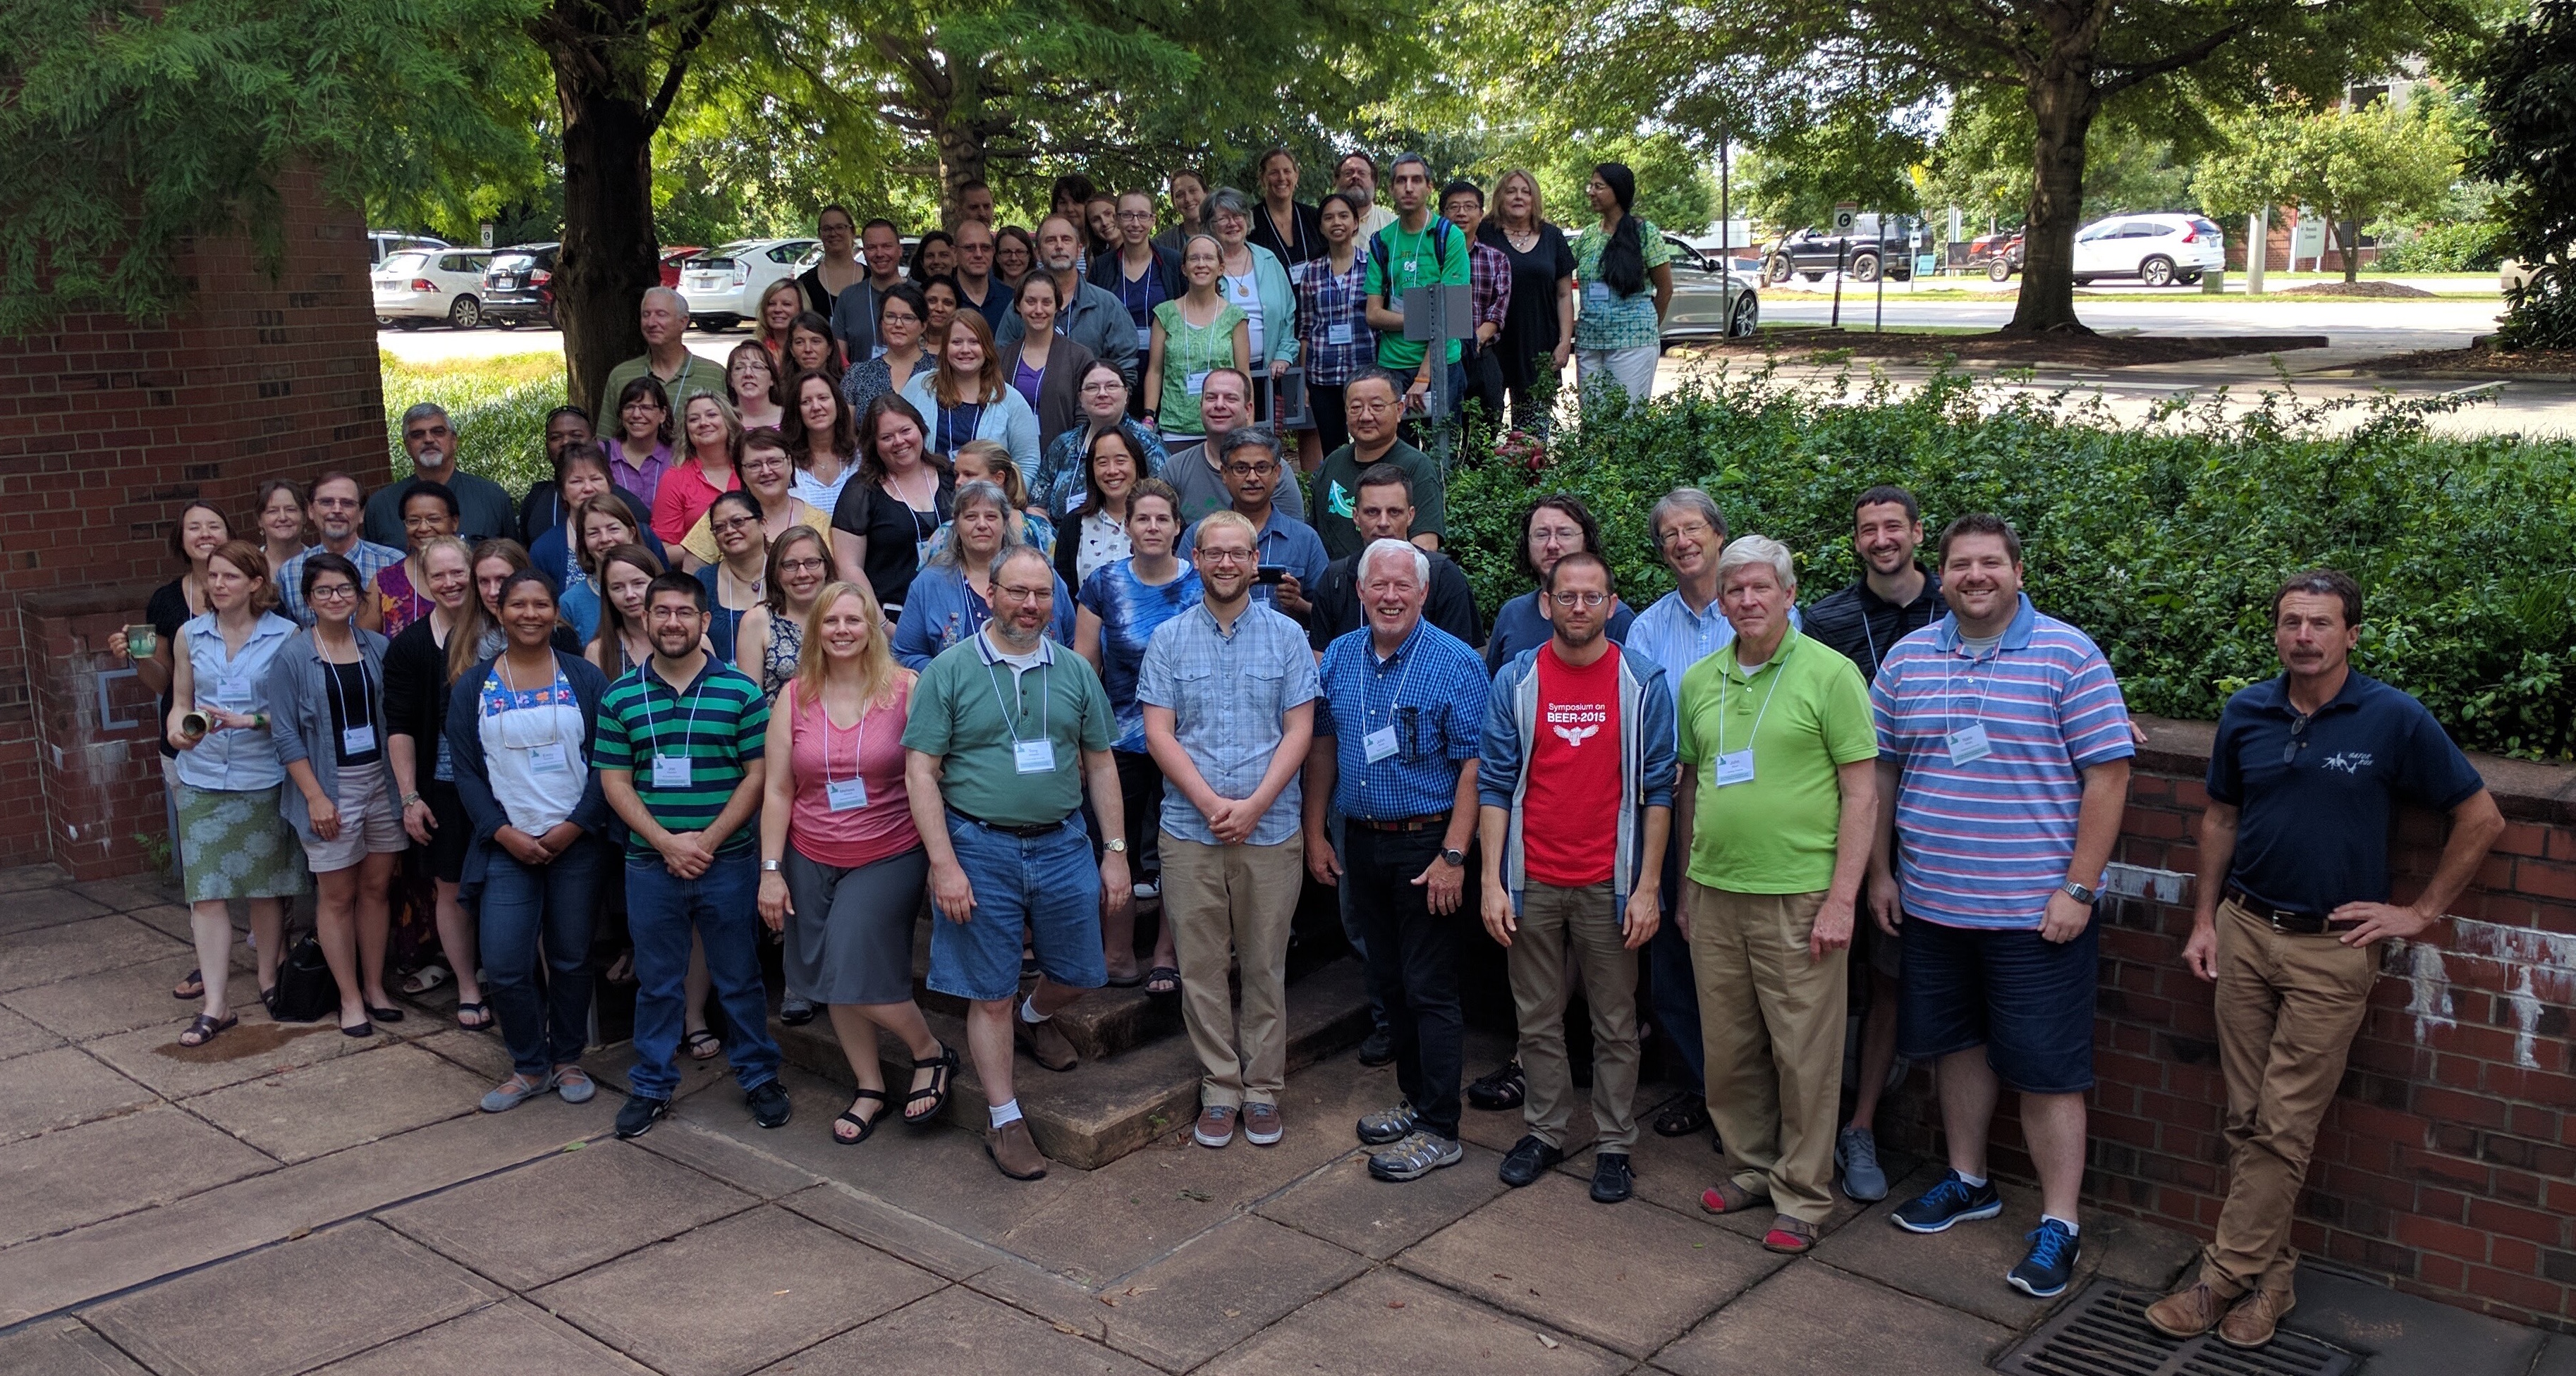
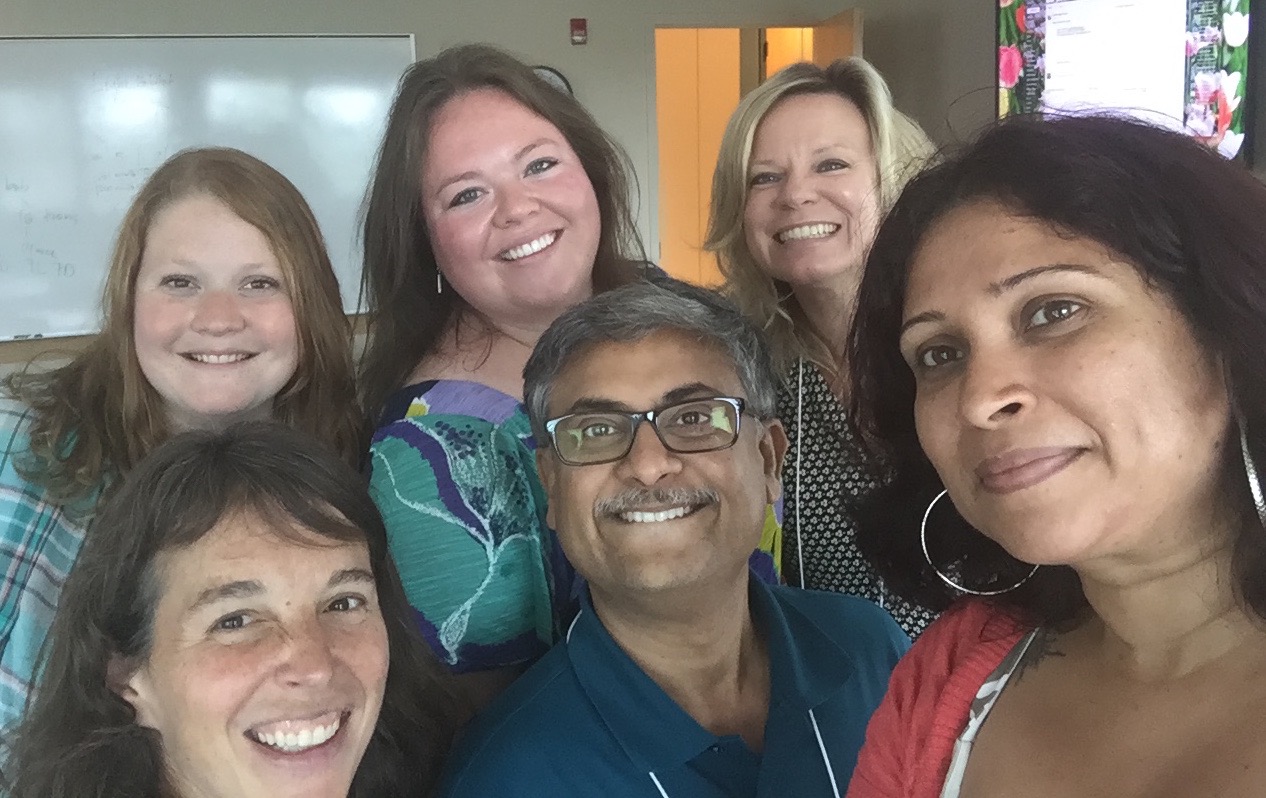 All the participants at the