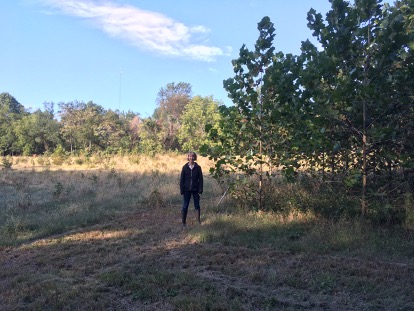
CO2 and trees, too much of a good thing?

The activities are as follows:
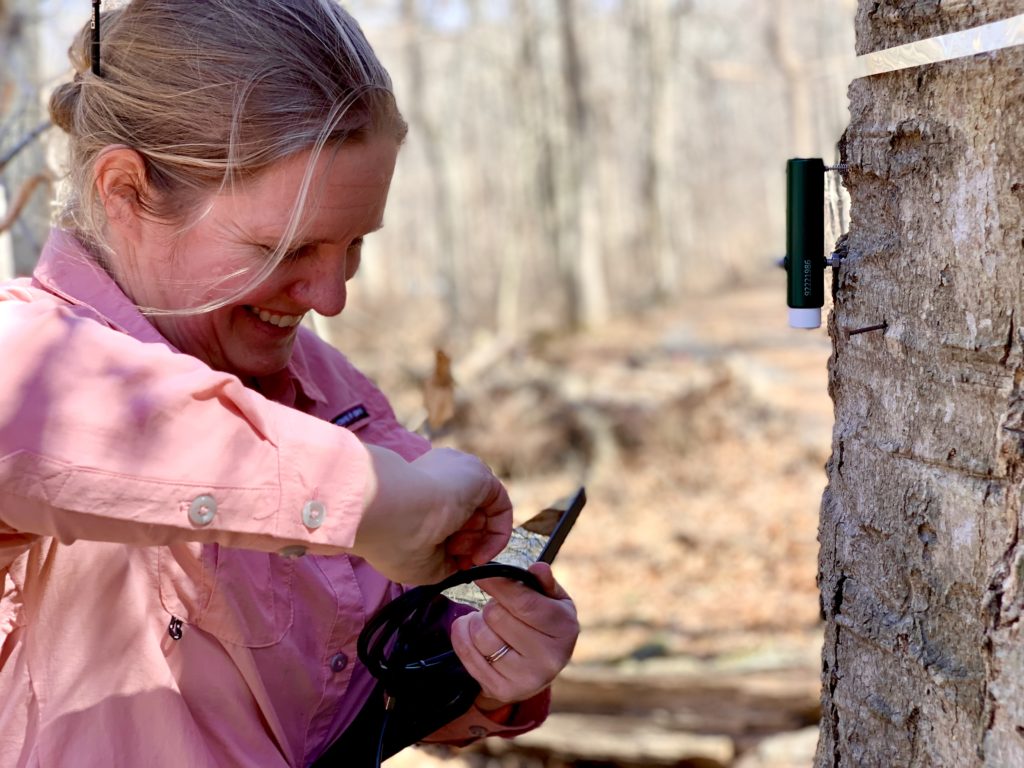
Kristina conducting the tree survey, measuring the size of a tree, which will later be used to calculate the mass of carbon in that tree.

The amount of carbon dioxide (CO2) in the atmosphere has steadily increased since the start of the Industrial Revolution in 1750. This extra CO2 traps heat like a blanket, causing the global climate to warm. The resulting climate change effect is known and widely accepted in science. While scientists are certain that climate change is happening, they still have many questions about its impacts.

For example, scientists today are exploring whether climate change will help or hurt trees and forests. Many scientists think that elevated CO2 in the atmosphere can actually help trees. We can see why in the formula for photosynthesis:

6𝐶𝑂2+6𝐻2𝑂+𝐸𝑛𝑒𝑟𝑔𝑦→𝐶6𝐻12𝑂6 +6𝑂2

Carbon Dioxide + Water + Energy (sunlight) → Glucose + Oxygen

If you add more CO2 to the atmosphere, trees will have more resources for photosynthesis and can make more glucose. Glucose is food for the trees. Trees can use their glucose for growth, using it to make wood. However, trees sometimes have to put glucose towards other things. Just like us, plants break down glucose for energy through cellular respiration:

C6𝐻12𝑂6 +62→ 6𝐶𝑂2+6𝐻2𝑂+𝐸𝑛𝑒𝑟𝑔𝑦
Glucose + Oxygen → Carbon Dioxide + Water + Energy (ATP)
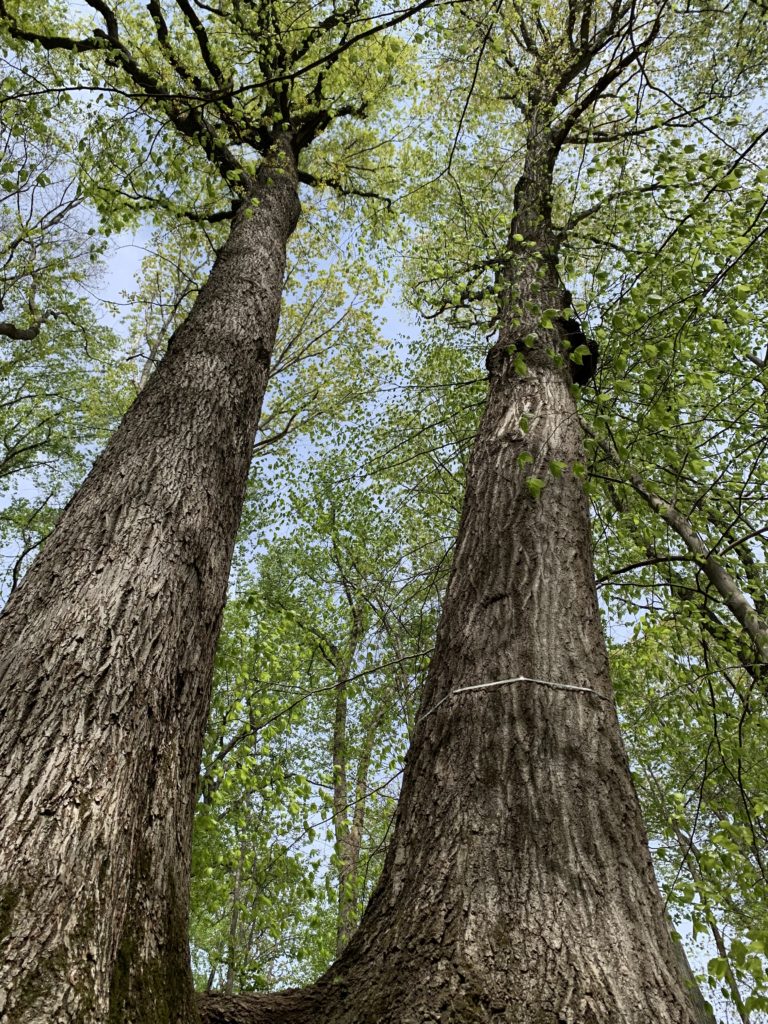
Two large trees stand in the experimental plot after a survey. The tree to the right has been banded to measure its growth.

Trees need energy for everyday functioning, or to respond to stress. Under climate change, trees might experience more stress. Stress for trees might increase if summer temperatures get too hot, or they don’t have enough water. More stress means more respiration and less growth. Or, even worse, the trees could die. Dead trees can’t photosynthesize, and they also decompose, which releases CO2 into the atmosphere
as microbes break down wood and other materials.

Kristina and Luca are scientists looking at the effects of climate change on trees. They wanted to test whether climate change was benefitting or hurting trees. They set out to find some data that would allow them to test these alternative hypotheses.
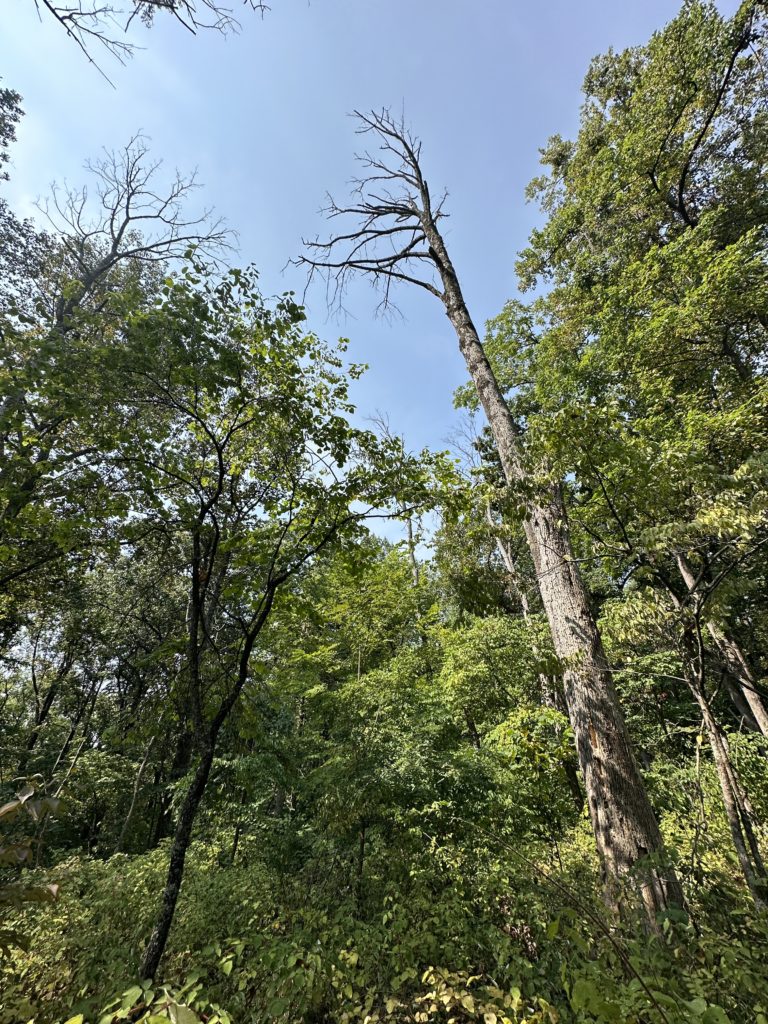
A dead ash tree stands in the experimental plot after a survey. The carbon in this tree
will return to the atmosphere through decomposition.

Kristina runs a tree census in a forest at the Smithsonian Conservation Biology Center in Virginia. Since 2008, she and many other scientists have surveyed every tree in their 26-hectare plot. Every five years, they count up how many trees are alive, how much they’ve grown, and how many have died. Luca joined Kristina’s lab in 2022. He and Kristina worked together with many other scientists to collect and process data on tree growth and mortality in 2023.

They used this growth and mortality data for individual trees to calculate levels of carbon gained and lost by the whole forest. The amount of carbon used for growth across the whole forest was measured as the mass of carbon gained. They also calculated the weight of the trees that died, which was measured as the mass of carbon lost. Both of these measurements were calculated in megagrams (Mg, that’s one million grams) of carbon (C) per hectare (ha) of forest per year (yr), or (MgC/ha/yr). The difference between these
two values is the change in carbon. This value gives the balance between carbon gained and lost. A positive value means there is more carbon being taken in by the forest than lost, and a negative value means that more carbon is being lost back to the atmosphere.

Featured scientists: Kristina J. Anderson-Teixeira (she/her) & Luca Morreale (he/him) at Smithsonian’s National Zoo & Conservation Biology Institute. Written by Ryan Helcoski
Flesch–Kincaid Reading Grade Level = 7.8

Too hot to help? Friendship in a changing climate

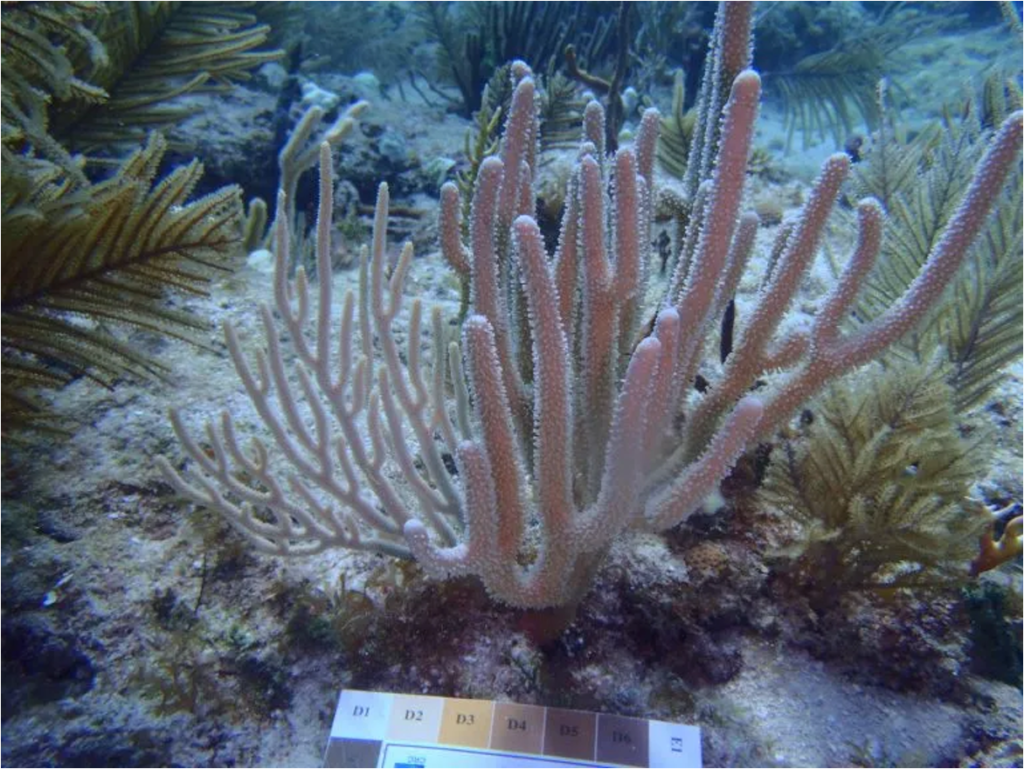
This coral has lost its algae partners, causing it to be bleached. (Photo by Coffroth Lab)

The activities are as follows:

When given emergency instructions on a flight, you’re told to put on your own oxygen mask before assisting others. This is because if you run out of oxygen, you won’t be able to help others. Turning to nature, this same idea may be true when we look at relationships between two species.

Coral and certain types of algae form a mutualism where both species benefit from the partnership. Coral provides a safe home for algae, and algae make food for coral through photosynthesis. However, climate change is causing warmer ocean temperatures that stress the relationship. If the water gets too hot for algae, they can’t make food for the coral anymore. To survive, the algae must help themselves before they can help the coral.

Casey is a biologist interested in studying the changing coral-algae mutualism. He wants to know whether different individuals of the same algae species do better than others in warming waters. Individuals of the same species can have different traits. For example, each human person belongs to the same species, but each of us has different traits. This is largely because of our genetic composition for these traits, or genotypes. Casey set out to test if different algae genotypes were capable of being better mutualists under warm temperatures. If he could identify these genotypes, then maybe that could help protect coral in the future.

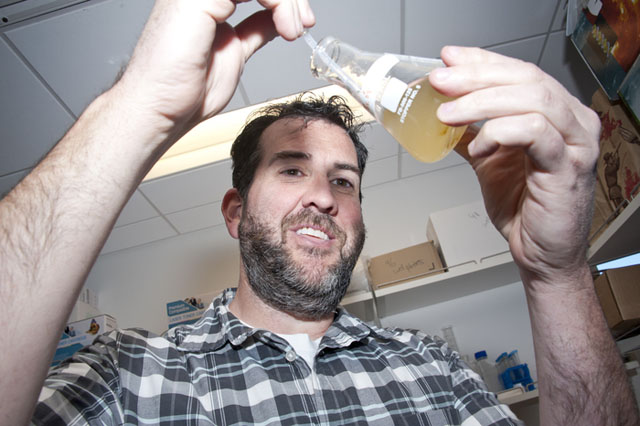
Casey gets a sample of algae from a flask in his lab. (Photo by David J. Hawkins)

Casey and his graduate student, Richard, set up experiments to test algae genotypes to see how well they performed at different temperatures. Casey and Richard grew five different genotypes of the same algae species in the lab. They used a pipette to transfer 10,000 cells of each genotype and placed them in flasks at two different temperatures. The lower temperature treatment is one where corals and their algae are usually happy: 26 degrees Celsius. The higher temperature treatment is where coral’s relationship with algae starts to break down: 30 degrees Celsius. At that temperature, many corals lose their algae entirely, in a process called coral bleaching.

Casey and Richard measured two things – the total amount of photosynthesis and the total amount of respiration happening in each flask. They did this by tracking what happened to oxygen over time. When there is a lot of photosynthesis, oxygen goes up, and when there is a lot of respiration, oxygen goes down. Two conditions are best for the mutualism. First, a lot of photosynthesis means the algae produced more food that they can share with coral. Second, less respiration means the algae used less of the food for themselves and have more to share with the coral. In summary, when the algae is stressed it does less photosynthesis and more respiration, making it a worse trading partner for coral. The best algae partner is the genotype that can photosynthesize the most and respire the least. The net food available is how much of the food made through photosynthesis is available after subtracting the food used by respiration.

Featured scientists: Casey terHorst (he/him) and Richard Rachman (he/him)

from California State University Northridge

Flesch–Kincaid Reading Grade Level = 8.9

Additional teacher resources related to this Data Nugget

Breathing in, Part 1

Susan stands in a reforestation experiment near the Chesapeake Bay.

The activities are as follows:

Photosynthesis is the process by which trees and other plants trap the sun’s energy within the molecular bonds of glucose (C6H12O6), a type of sugar. During photosynthesis, oxygen (O2) is released as a byproduct. For this reason, trees are often portrayed as the lungs of the planet “breathing out” oxygen.

Oxygen is then used by living things for cellular respiration. Your cells use oxygen to free the energy stored within glucose. That is why you, and most living things, need oxygen to survive.

But there’s another aspect of photosynthesis that’s just as important as the release of oxygen. Look at a tree or other plant out your window – how did it get so big? The answer is in the equation for photosynthesis. Carbon dioxide (CO2) and water (H2O) provide the carbon, hydrogen, and oxygen needed to build glucose. Trees use glucose as both an energy source and construction material. As they grow, they arrange glucose in long, winding structures. Some of this carbon becomes part of the plant for as long as they live. This means that the carbon that builds plants comes from the air! This process of pulling carbon out of the atmosphere and holding on to it for long periods of time is known as carbon sequestration or carbon accumulation. It’s what the trees do when they use photosynthesis to “breathe in.”

These processes caught Kristina’s interest. She wanted to know more about how carbon accumulation differed across the globe. So, in 2006, she and a small team of scientists created a database using information from 91 studies on carbon in trees.

In the meantime, Susan was working at the Nature Conservancy and getting tons of questions from people who wanted to plant new forests to help fight climate change. People wanted to know what kinds of forests to plant, and how much carbon they might be able to accumulate. Susan, like Kristina, knew that carbon accumulation differed across the globe and wanted to give people the right numbers for the right places. She started gathering carbon data by sifting through thousands of scientific papers. In the process, she found Kristina’s work. One day, Susan called Kristina to chat.

Kristina and Susan decided they needed to work together to learn more about how carbon accumulation rates differ across various types of forests found around the world. So, they set out to build on previous research and get more accurate measurements. Instead of doing their own new study, they needed to gather data from thousands of existing studies in locations from all over the earth. So that’s exactly what they did. Kristina and Susan, along with an international team of researchers, began their work creating ForC, the Global Forest Carbon Database.

ForC is an open-access database containing over 40,000 records from more than 10,000 plots in over 1,500 geographic areas. All of the data come from published research by scientists and include studies from every forested climate zone. It is a living database that is always being updated as scientists publish their work, making it the most complete source of forest carbon data in the world! It was exactly what Kristina and Susan needed.

Kristina and Susan used ForC to investigate global carbon capture by young regrowing forests. Based on their previous research, they thought that, since tropical forests regrow fastest due to a year-round warm and wet climate, they would have the highest rate of carbon accumulation. In order to study carbon accumulation, they selected 13,112 measurements from young, regrowing (<30 years old) forests around the world. They grouped measurements by forest type, averaged them, and compared their data. With these values, they could inform policy decisions and prioritize forest regrowth in parts of the world that would have the highest impact. Review the table below for information on the six main forest types that Kristina and Susan studied.

Featured scientists: Kristina J. Anderson-Teixeira, Smithsonian Conservation Biology Institute & Susan C. Cook-Patton, The Nature Conservancy. Written by Ryan Helcoski.

Flesch–Kincaid Reading Grade Level = 9.1

Additional classroom resources for this Data Nugget:
If you would like to explore the ForC database in your classroom, students can view the shiny app. Anyone that feels even more ambitious can see the raw data.

Here are two scientific articles related to this activity:

Cook-Patton, SC, Leavitt, SM, Gibbs, D. et al. 2020. Mapping carbon accumulation potential from global natural forest regrowth. Nature 585, 545–550.

Anderson KJ, Allen AP, Gillooly JF, Brown JH. 2006. Temperature-dependence of biomass accumulation rates during secondary succession. Ecology Letters Jun: 9(6):673-82.