 Article originally published on MSU Today. Link to original posting can be found here.

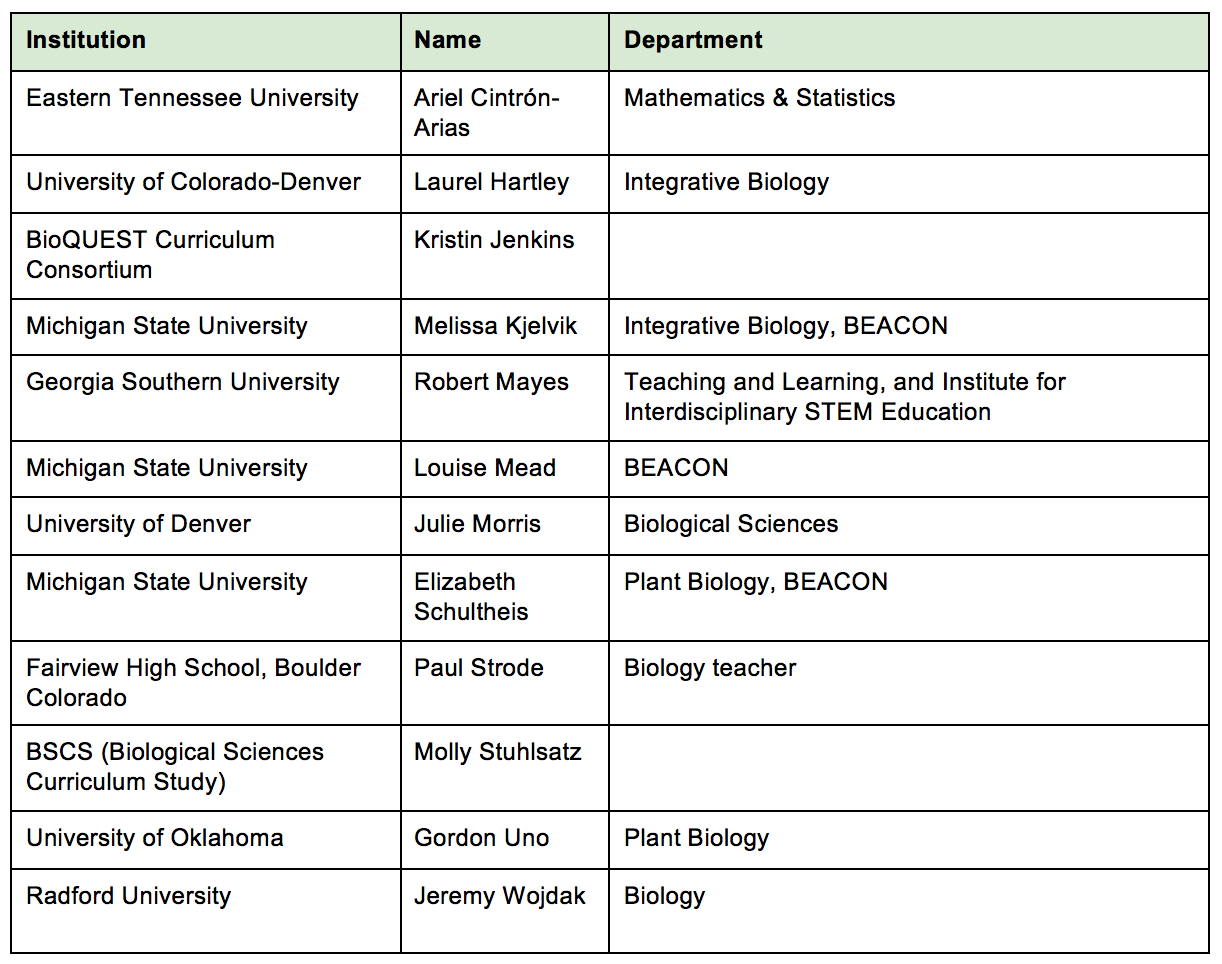
“Data Nuggets rock, and now we can investigate how and why,” said Louise Mead, education director of the BEACON Center for the Study of Evolution in Action, a National Science Foundation funded center headquartered at Michigan State University.
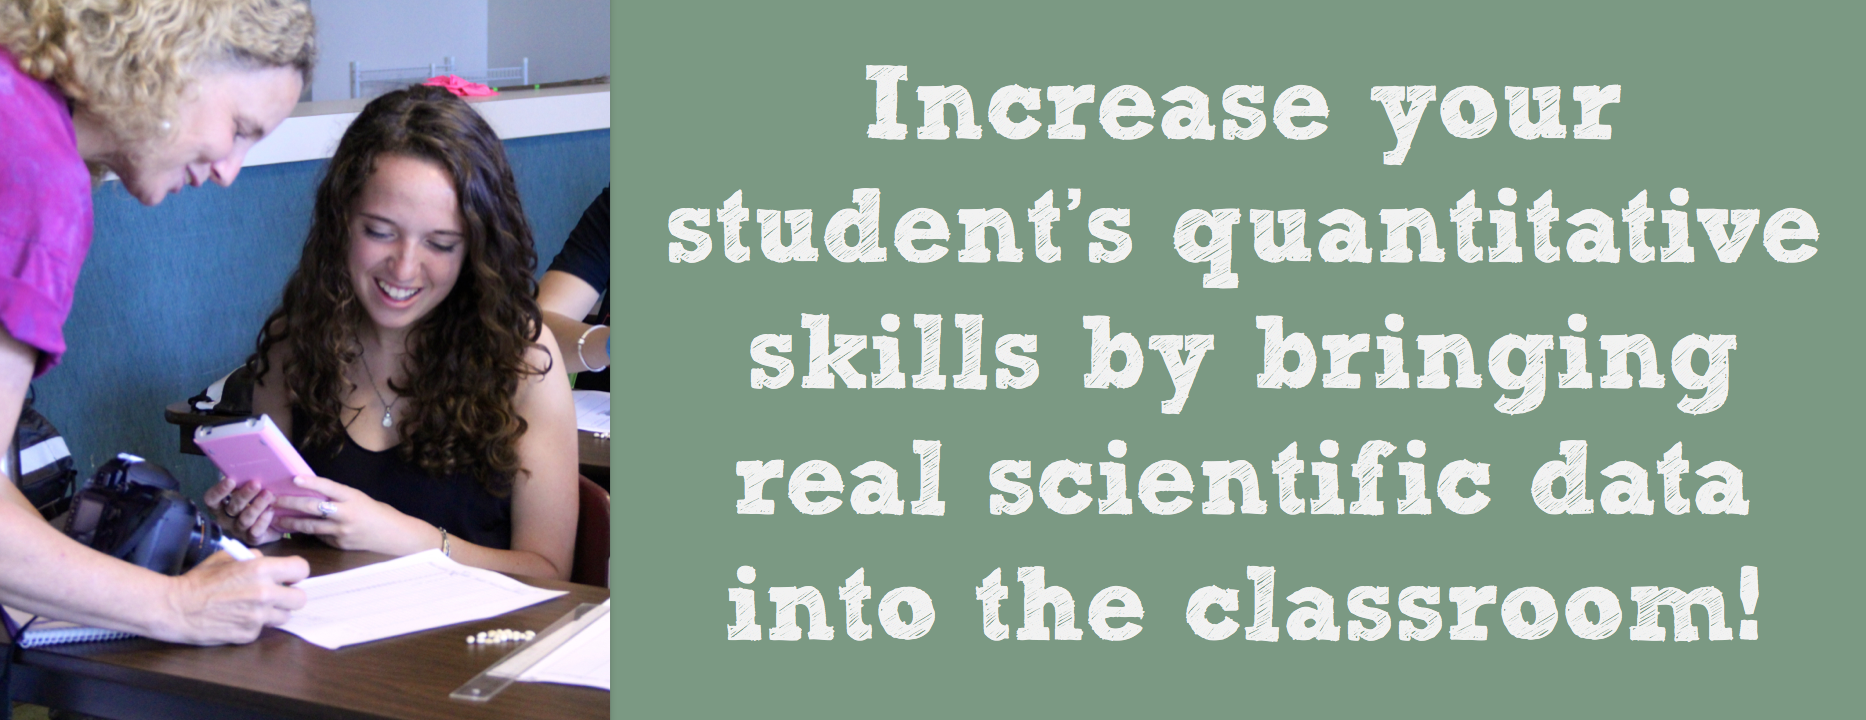
MSU received a $1.1 million grant from the NSF to research the effectiveness of Data Nuggets, a science education project co-designed by MSU scientists and teachers. Data Nuggets are educational activities that bring real scientific data into the classroom, giving students practice interpreting quantitative information and making claims based on evidence. MSU will collaborate in this research with the Biological Sciences Curriculum Study, a non-profit curriculum study committed to transforming science teaching and learning.
“This is what teachers are asking for and it’s well aligned with the next generation of science practices,” said Mead, an evolutionary biologist, researcher and educator. “K-12 teachers see their students struggling in quantitative reasoning skills and science, and they’re looking for new and innovative approaches in the classroom.”
Developed in 2011 at MSU’s Kellogg Biological Station, Data Nuggets are used to engage K-12 students in the practices of science by challenging them to answer a scientific question using data to support their claim. The questions and data are from real research, provided by scientists and presented in a way that is accessible for K-12 classrooms. Students are guided through the construction of graphs to aid data interpretation during the modules, which are offered in a range of scientific research themes, from animal behavior to ecology to agriculture.
“I am so thrilled to see the excitement surrounding Data Nuggets whenever we present them to teachers and scientists,” said Elizabeth Schultheis, who along with fellow postdoctoral researcher Melissa Kjelvik developed Data Nuggets. “And as a scientist I am looking forward to collecting data on Data Nuggets to see if they do what we predict they’ll do.”
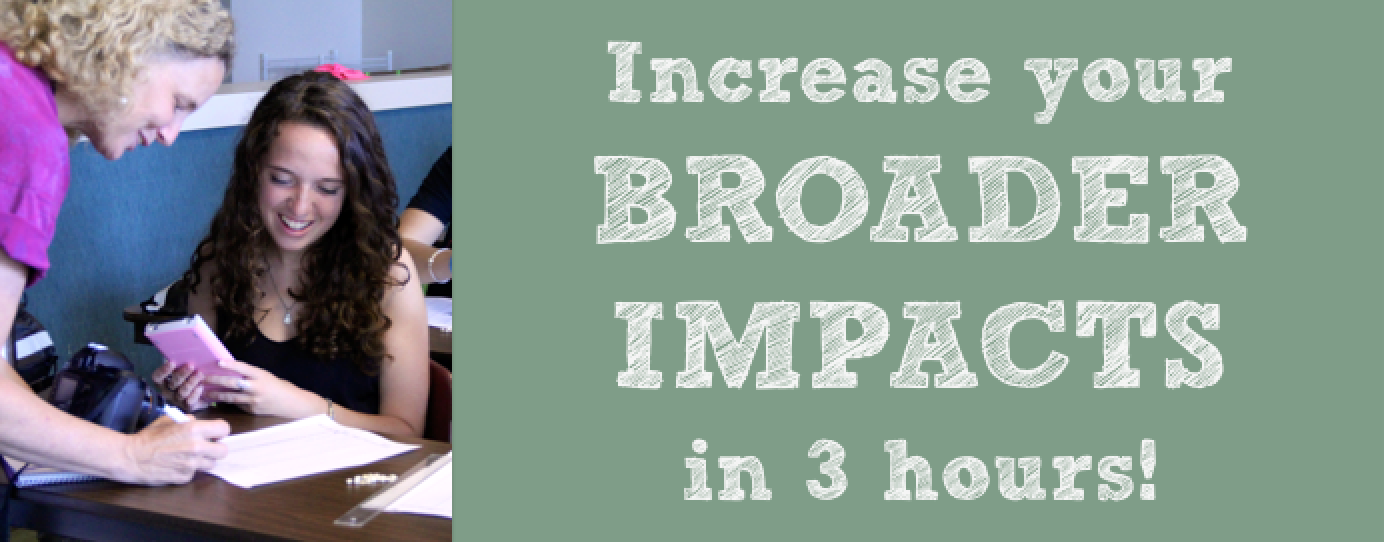
The new NSF grant will allow research examining whether short, targeted interventions of classroom activities embedded within a typical curriculum can impact student outcomes. The results could provide teachers with information about supplementing their current lesson plans with classroom activities like Data Nuggets, specifically targeted at improving students’ understanding of science.
“The big picture is that the U.S. is falling behind in math and science, and this might give us a chance to help both teachers and students,” Mead said. “Data Nuggets gives these students a step up, so that when they go to college they’ve already analyzed data and formed hypotheses.”
By providing students with access to authentic science and data, Data Nuggets hopes to bridge the gap between scientists and the public. Scientists who create Data Nuggets lessons will be able to share the process of science and research findings with students and teachers, and help to improve the understanding of science in society.
“Because Data Nuggets originated from a partnership of teachers and scientists, they address both the needs of scientists to share their research broadly and improve their communication skills, and of teachers who need resources that address science reform and teach science in an authentic way,” Schultheis said.