The activities are as follows:

- Teacher Guide
- Student activity, Graph Type A, Level 4
- Student activity, Graph Type B, Level 4
- Student activity, Graph Type C, Level 4
- PowerPoint of images
- Grading Rubric
- ForC database information
In Part 1, you learned how trees “breathe in” and accumulate carbon dioxide within their tissues during photosynthesis. You also examined data from ForC, the Global Forest Carbon Database. Using this dataset, you studied how “breathing in” differed in regrowing forests around the world. Now it’s time to go a step further and see how Susan and Kristina used the ForC database to take action!
Like many other scientists, Susan and Kristina are concerned about global warming. Global warming is the well-documented rise of the temperature of Earth’s surface, oceans, and atmosphere. As of 2020, global temperatures are now warmer by about 1 °C (1.8 °F) than they were before people started burning a lot of fossil fuels in the late 1700’s. While this may seem like a small increase, it has already caused major changes on Earth.
To ease global warming, humanity needs to not only reduce their greenhouse gas emissions, but also to capture the excess greenhouse gases in the atmosphere. This is a huge motivating factor for Kristina and Susan’s investigation into regrowing forests in Part 1 and the main reason they created the ForC database.
Thankfully, Susan and Kristina are not alone. People from all around the world share their concern. That’s one of the reasons the Intergovernmental Panel on Climate Change (IPCC) was established in 1988 by the United Nations. The IPCC is dedicated to providing the world with reliable scientific information on the risks, impacts, and response options of climate change. So, it makes sense that the IPCC is also interested in data on carbon accumulation due to forest regrowth.
Susan and Kristina wanted to make sure that the IPCC has the most precise data available in order to better inform policy decisions. They were confident their dataset would improve upon what the IPCC had available when they calculated their estimates. They hoped their work would be incorporated into the IPCC’s next update.
Kristina and Susan thought that the forest carbon accumulation values calculated by ForC would be different than those provided by the IPCC. They anticipated their values would be more precise because of the additional variables they had compiled. In the end, they and their colleagues combined field measurements with 66 environmental variables that could affect carbon accumulation in young regrowing forests. This fine-tuned model was used to create a global map that predicts the potential aboveground carbon accumulation for the first 30 years of forest regrowth. They were able to look at the varying forest types at a finer scale, zooming in to a resolution of one kilometer!

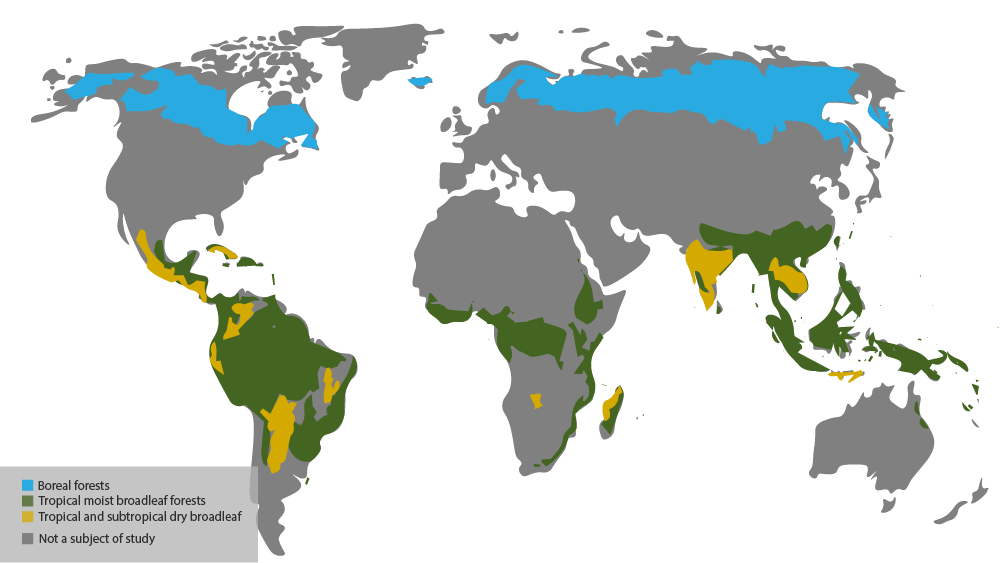
However, before Susan and Kristina would present their map model to IPCC, they needed to first compare their values with the IPCC’s current model. They chose to focus on three forest types: boreal, tropical dry broadleaf, tropical moist dryleaf. They looked at each forest type on three different continents and compared the estimated values from the IPCC model to the ForC model. If the ForC model is more precise, they expected to see very different values for different locations of the same forest type. If ForC did not increase precision, the values for each continent would be similar to the IPCC values in each forest type.
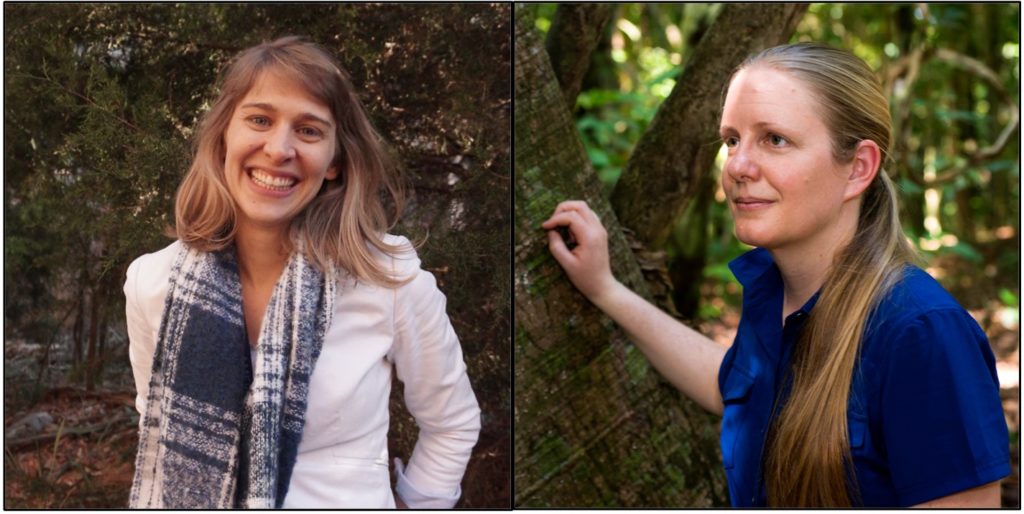
Featured scientists: Kristina J. Anderson-Teixeira, Smithsonian Conservation Biology Institute & Susan C. Cook-Patton, The Nature Conservancy. Written by Ryan Helcoski.
Flesch–Kincaid Reading Grade Level = 10.0
Additional classroom resources for this Data Nugget:
- If you would like your students to view the data from the IPCC, you can view Chapter 4 of Volume 4 of the 2019 refinement to the 2006 IPCC Guidelines for National Greenhouse Gas Inventories.
- There is a scientific journal article and blog post that you can use as a follow-up to this activity and practice reading comprehension with your students.
- ForC Education: There are lesson plans that can be used to examine the ForC database. This is a private link with additional lesson plans for anyone interested in further exploring the database and asking original questions.
