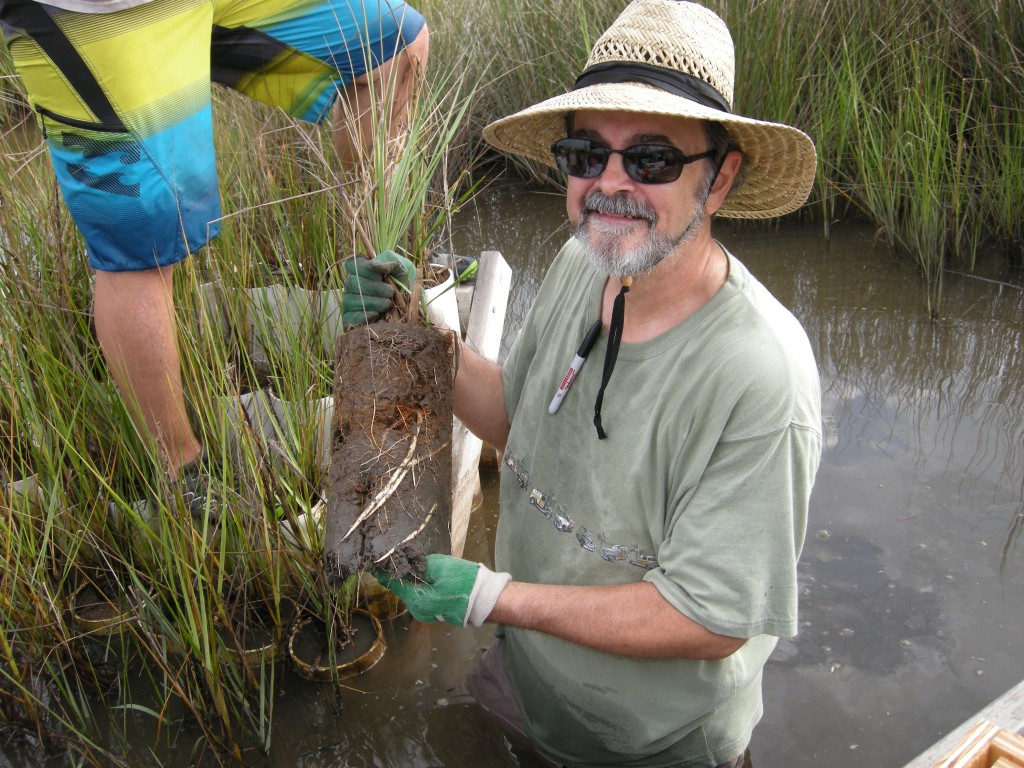
Scientist James collecting plants in a Massachusetts marsh, part of the Plum Island Ecosystems Long Term Ecological Research site
The activities are as follows:
- Teacher Guide
- Student activity, Graph Type A, Level 3
- Student activity, Graph Type B, Level 3
- Student activity, Graph Type C, Level 3
- Grading Rubric
Tides are the rise and fall of ocean water levels, and happen every day like clockwork. Gravity from the moon and sun drive the tides. There is a high tide and a low tide, and the average height of the tide is called the mean sea level. The mean sea level changes seasonally due to the warming and cooling of the ocean throughout the year. It also changes annually due to a long-term trend of ocean warming and the melting of glaciers. Scientific evidence shows that climate change is causing the sea level to rise faster now than it has in the past. As the climate continues to warm, it is predicted that the sea level will continue to rise.
Salt marshes are wetlands with plains of grass that grow along much of the ocean’s coast worldwide. These marshes are important habitats for many plants and animals, and protect our shores from erosion during storms. They grow between mean sea level and the level of high tide. Marshes flood during high tide and are exposed to the air during low tide. The health of a salt marsh is determined by where it sits relative to the tide (the “zone”). A healthy marsh is flooded only part of the time. Too much flooding and too little flooding are unhealthy. Because they are so important, scientists want to know if salt marshes will keep up with sea level rise caused by climate change.

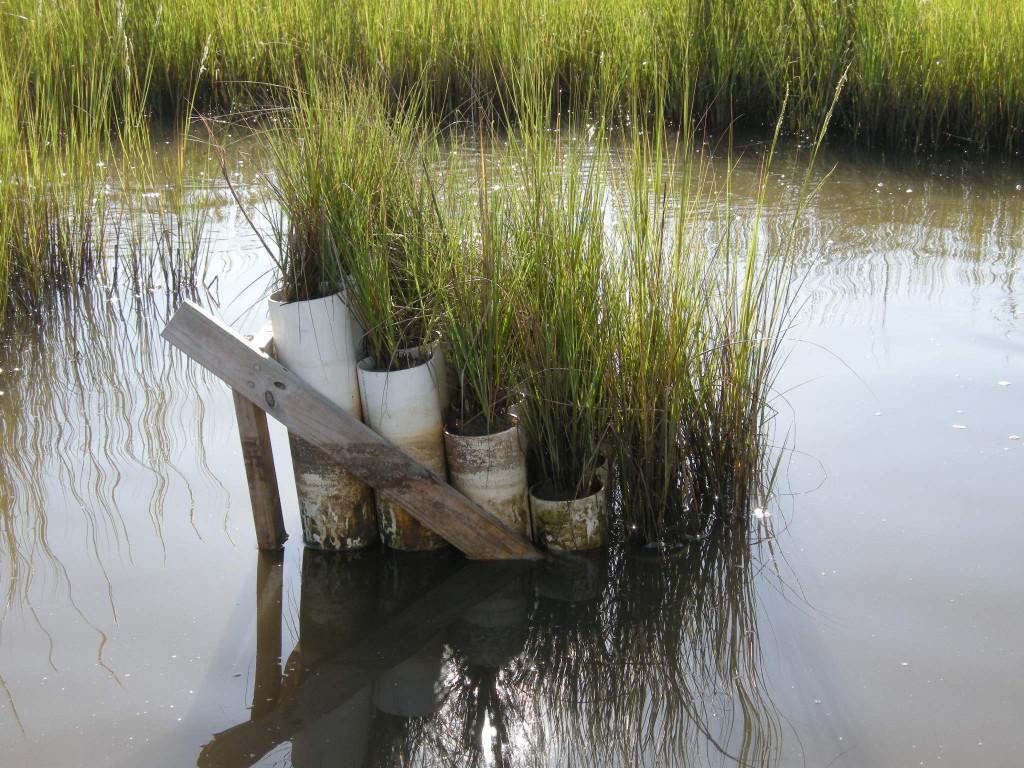
A picture of James’ “marsh organ” which holds plants at different elevations relative to mean sea level. He gave it that name because it resembles organ pipes!
In the 1980s, scientist James began measuring the growth of marsh grasses. He was surprised to find that there was a long-term trend of increasing grass growth over the years. James wanted to know if grasses could continue to keep up with rising sea levels. If he could experimentally manipulate the height of the grasses, relative to mean sea level, he might be able to figure out how grasses will do when sea levels are higher. To test this, James invented a way to experimentally grow a marsh at different elevations relative to mean sea level. He built a device he called the “marsh organ”. This device is made of tubes that stand at different elevations and are filled with marsh mud and planted with marsh grasses. He measured the growth of the grass in each of the pipes. If grasses will continue to grow taller in the future with higher water levels, then plants growing in pipes at lower elevations should grow more than plants growing in pipes with higher elevations.
Featured scientist: James Morris from the University of South Carolina
Additional teacher resource related to this Data Nugget: Jim has created an interactive salt marsh model called the “marsh equilibrium model”. This online tool allows you to plug in different marsh levels to explore potential impacts to the salt marsh. To explore this tool click here.
To read more about Jim’s research on “tipping points” beyond which sediment accumulation fails to keep up with rising sea level and the marshes drown, click here.
There are two publications related to the data included in this activity:
- Morris, J.T., Sundberg, K., and Hopkinson, C.S. 2013. Salt marsh primary production and its responses to relative sea level and nutrients in estuaries at Plum Island, Massachusetts, and North Inlet, South Carolina, USA. Oceanography 26:78-84.
- Morris, J.T., P.V. Sundareshwar, C.T. Nietch, B. Kjerfve, D.R. Cahoon. 2002. Responses of coastal wetlands to rising sea level. Ecology 83:2869-2877.
