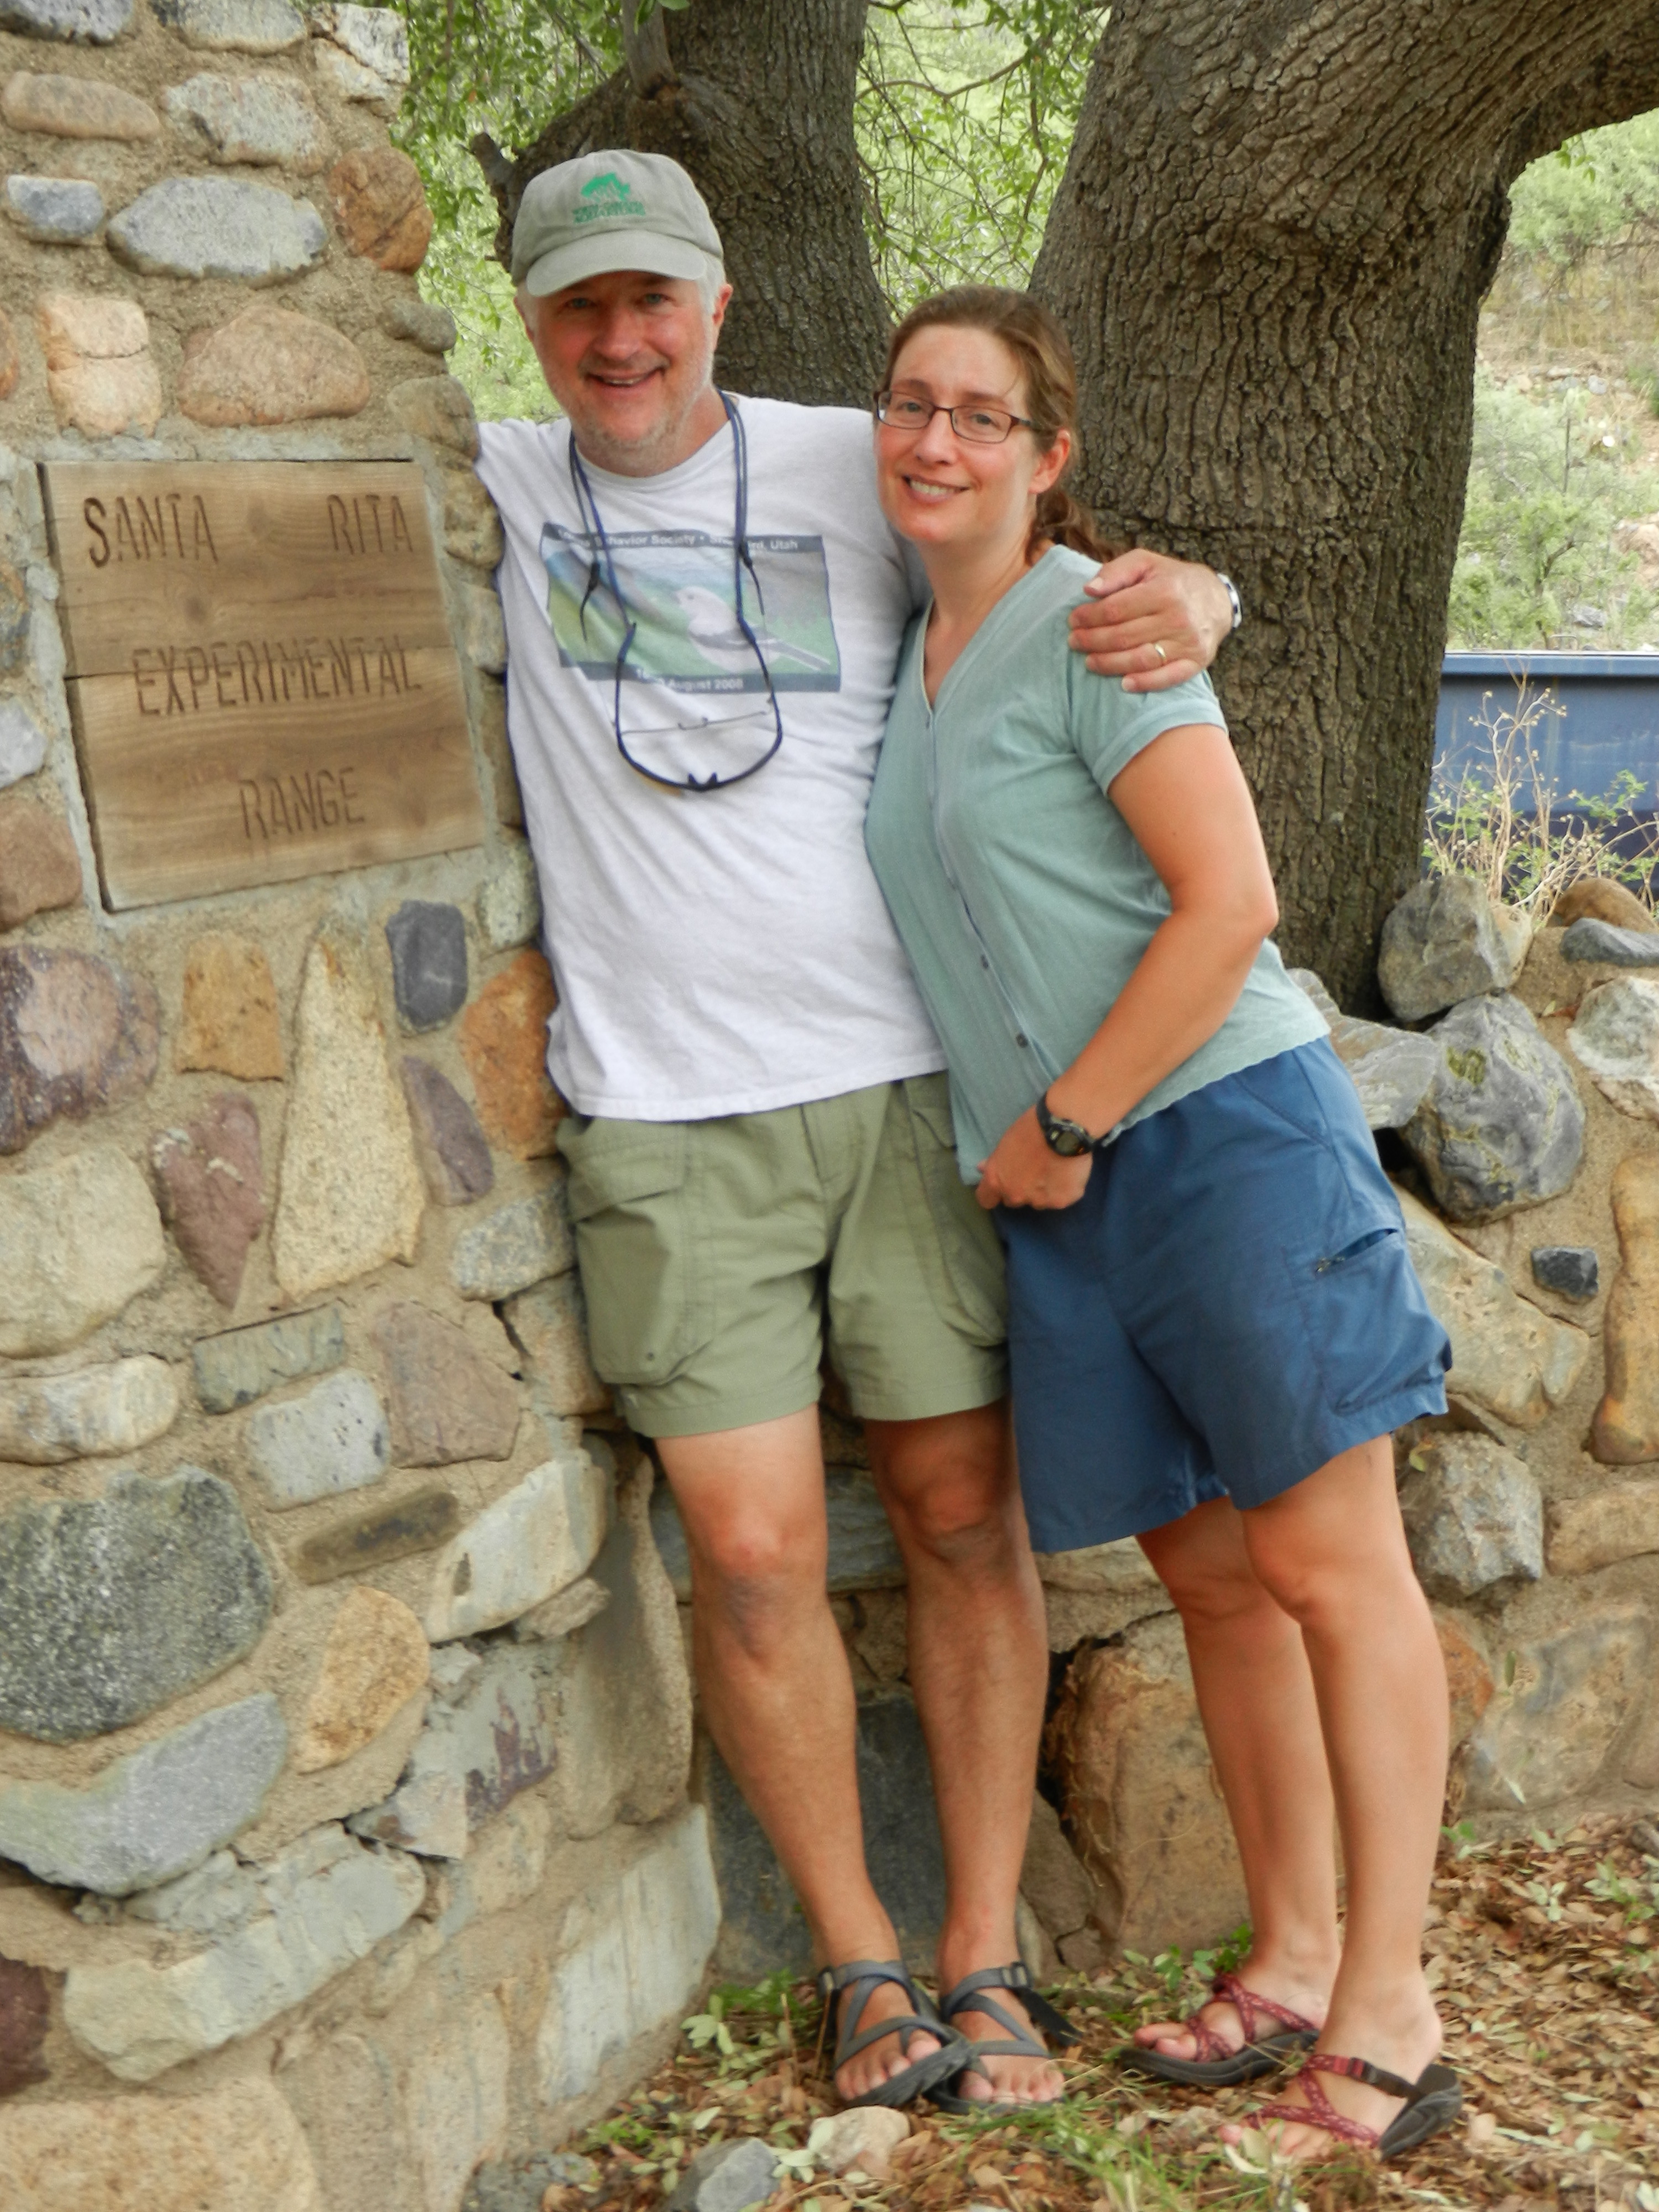
Ashlee and Matt Rowe at the Santa Rita Experimental Range in Arizona
The activities are as follows:
- Teacher Guide
- Student activity, Graph Type A, Level 2
- Student activity, Graph Type B, Level 2
- Student activity, Graph Type C, Level 2
- Powerpoint of Images
- Grading Rubric
- Digital Data Nugget on DataClassroom
Animals have evolved many ways to defend themselves against predators. Many species use camouflage to avoid being seen. Others rely on speed to escape. Some species avoid capture by hiding in a safe place. Other animals use painful and venomous bites or stings to try to prevent attacks or to make being captured more difficult. Anyone who has been stung by a bee or wasp understands how stinging could be a great way to keep predators away! However, there is little research that documents if painful stings or bites deter predators.
The grasshopper mouse lives at the base of the Santa Rita Mountains in Arizona. Scientists Ashlee and Matt have been studying populations of this mouse for many years and wanted to know what the mouse ate. In the mountains, there are two scorpions that make a great food source for the mice. One of the scorpion species has a painful sting. The other species is slightly larger, but its sting is not painful. Ashlee and Matt thought that the use of a painful, venomous sting helped the smaller species avoid most predator attacks.
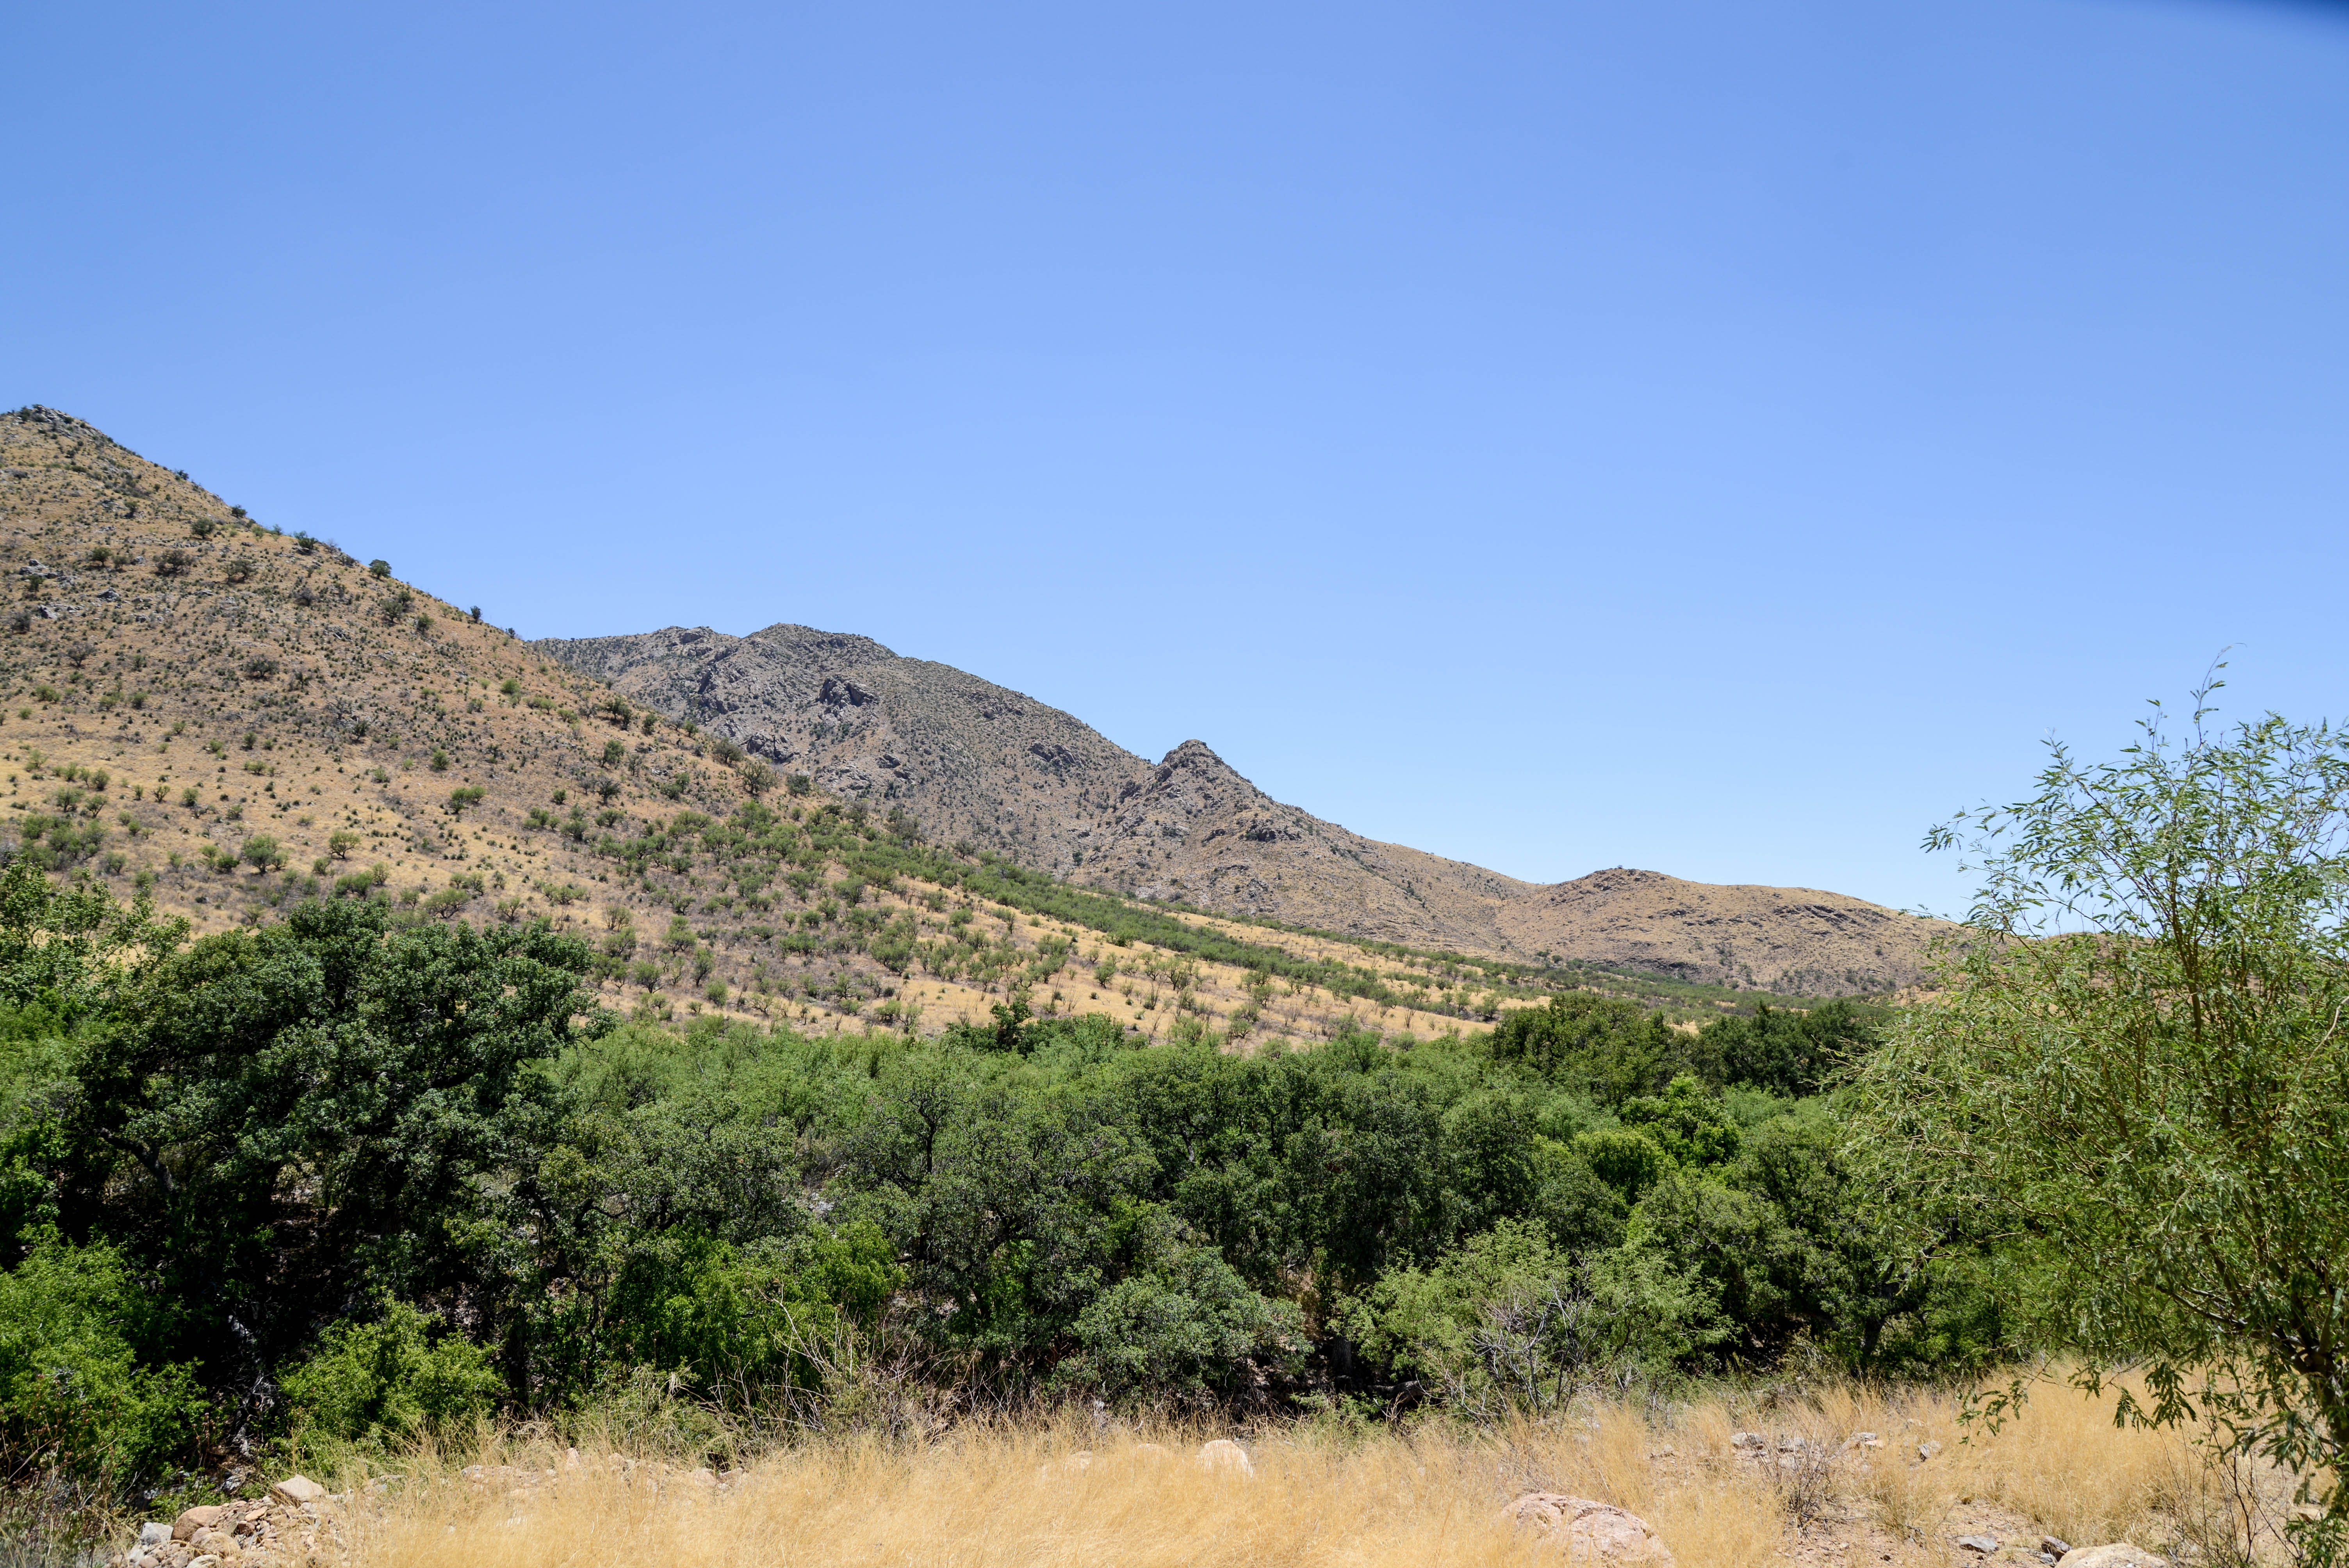
The Santa Rita foothills – habitat for the grasshopper mouse and scorpions
The scientists collected six grasshopper mice from the wild. Back in the lab, they trained the mice to expect a food reward when they tipped over a small cup containing live prey. Once trained, the mice were used in an experiment. The mice were presented with two cups to choose from. One contained the small scorpion species that has a painful sting. The other cup contained the larger scorpion species that has a painless sting. Ashlee and Matt collected data on which cup the mice chose to approach, inspect, or pursue (by tipping over the cup). They also recorded if the mice attacked or consumed the painless or painful species of scorpion. Each trial ended when the mouse finished consuming one of the scorpions. If painful stings prevent a predator from attacking, they predicted the mice would choose to eat the scorpion species with the painless sting more often.
Watch a video of one of the experimental trials:
Watch five additional videos on the grasshopper mouse and scorpions:
- A video on the grasshopper mouse and how it deals with scorpion venom
- The Anomalies: Venom Race
- Deep Look: Stinging Scorpion vs. Pain-Defying Mouse
- Video of grasshopper mouse battling and consuming bark scorpion
- Scorpion Hunters – See the Rowe lab as they go out into the field to collect scorpions for their research
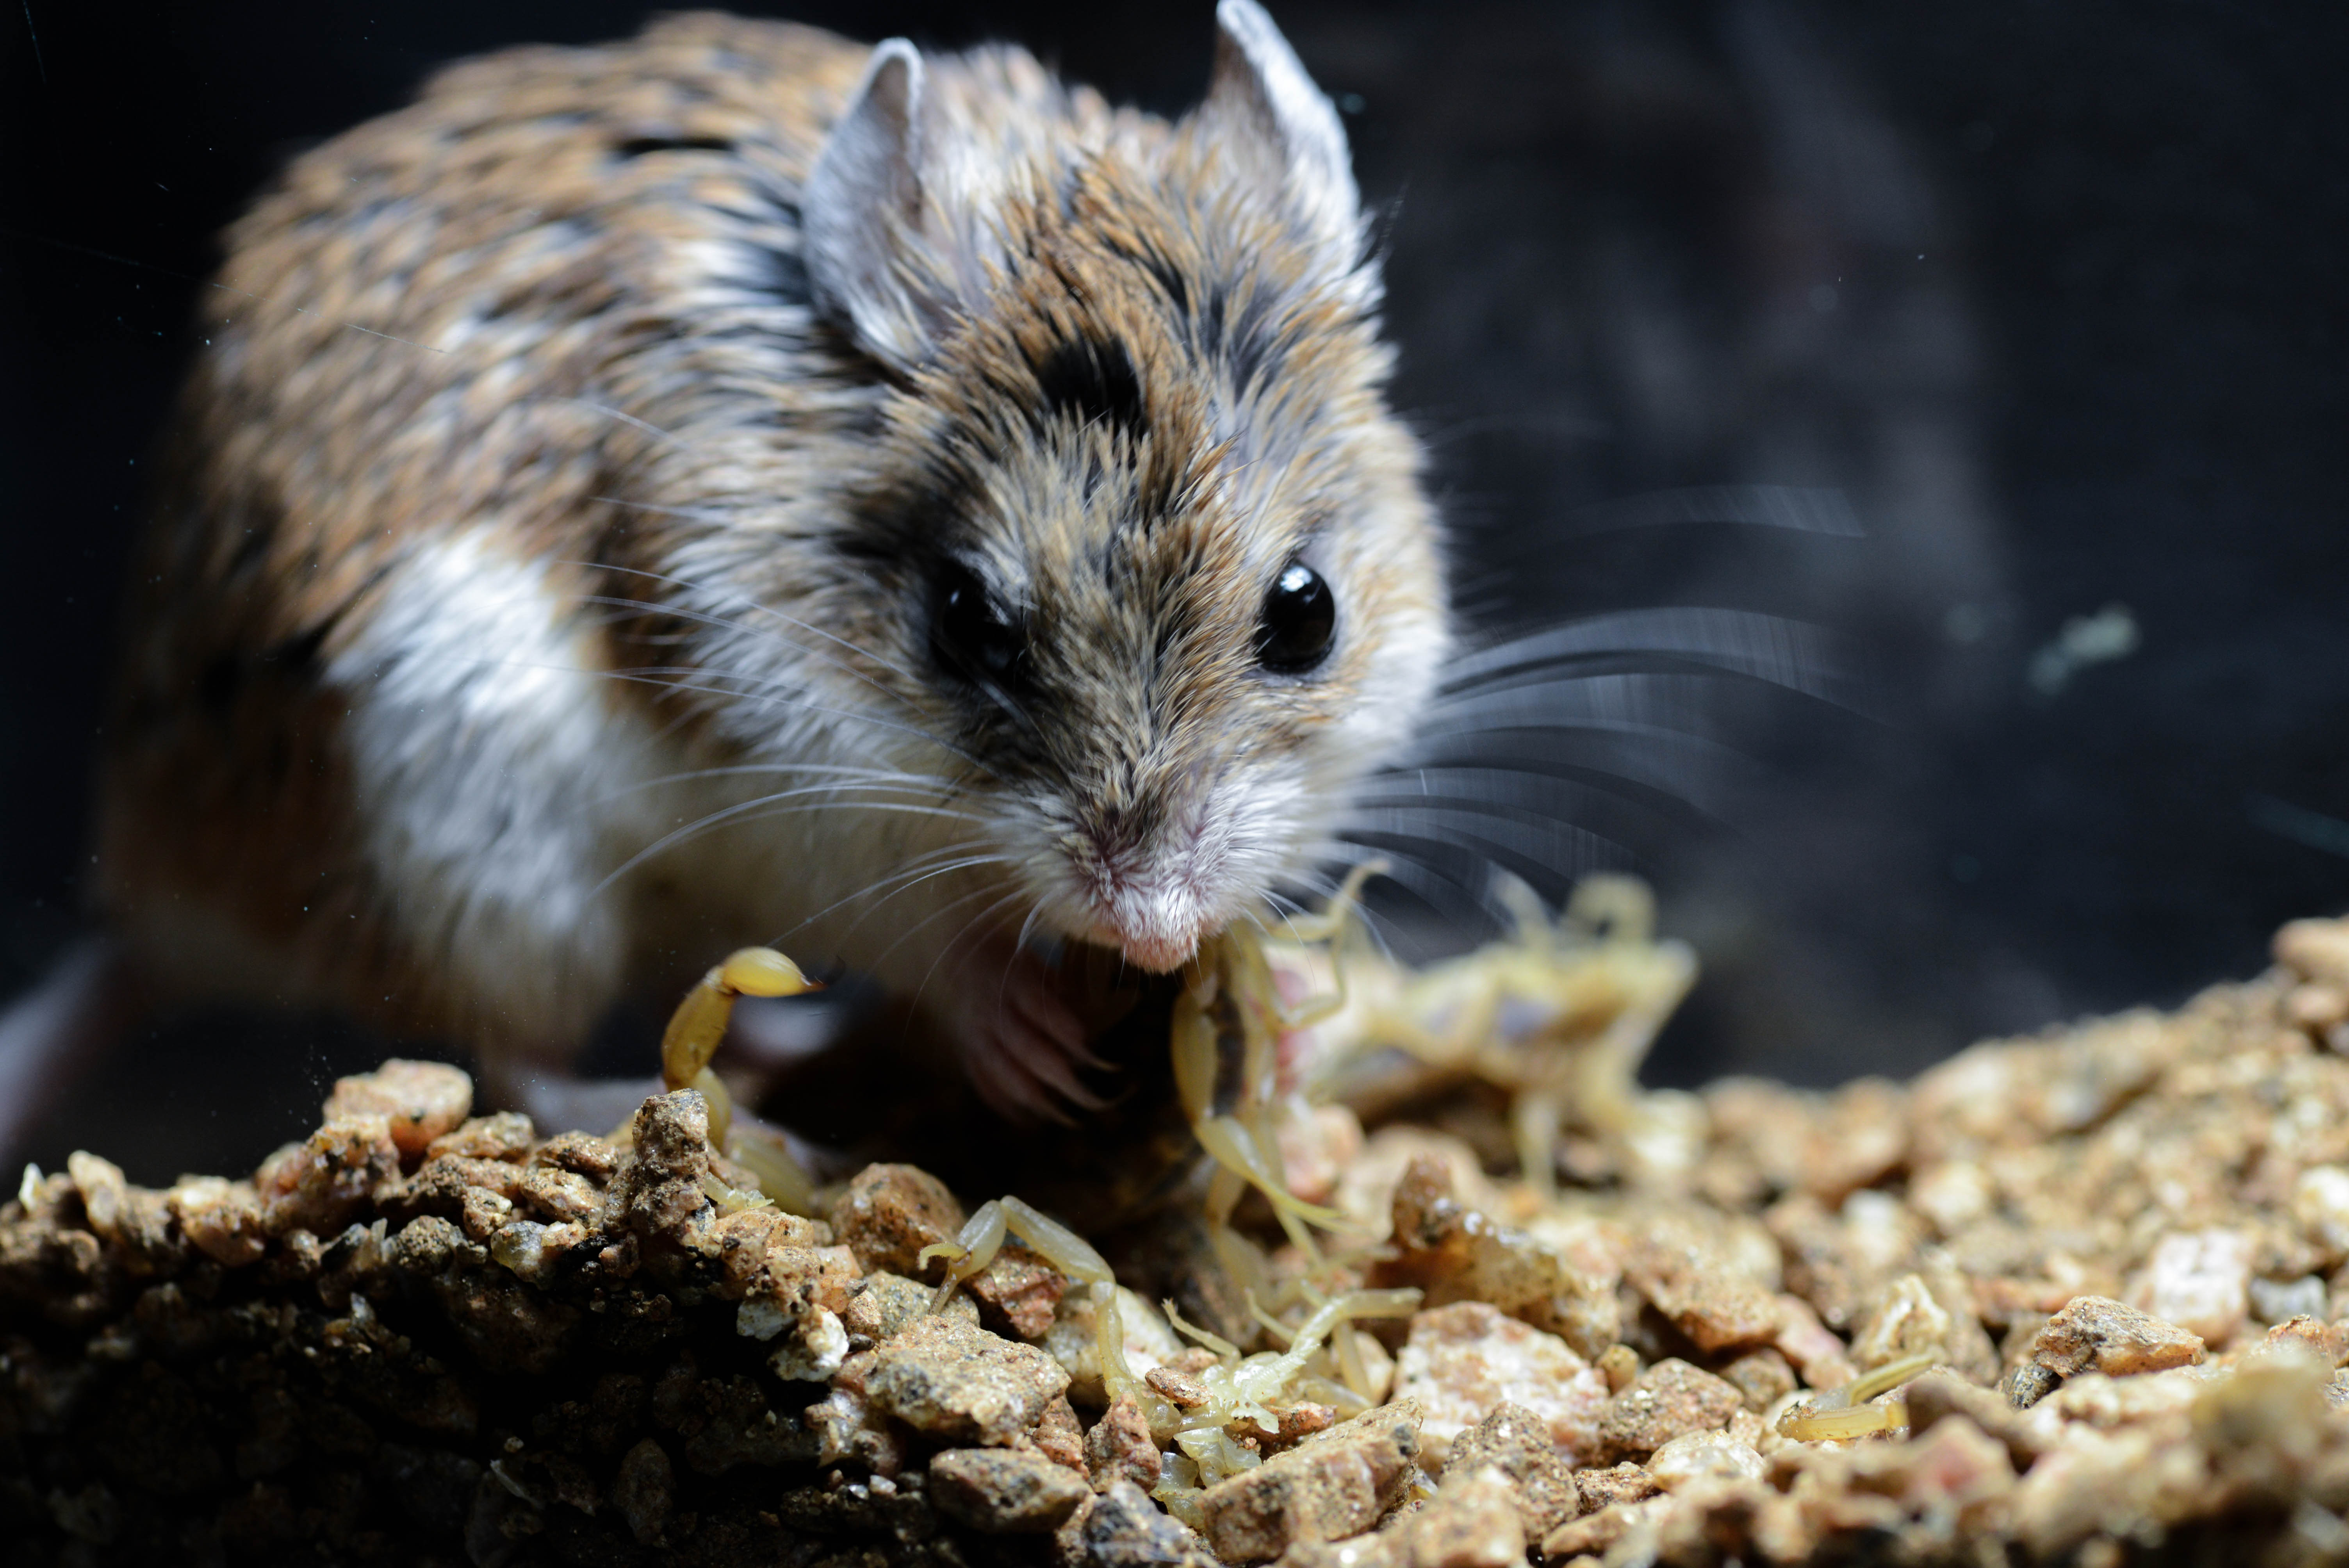
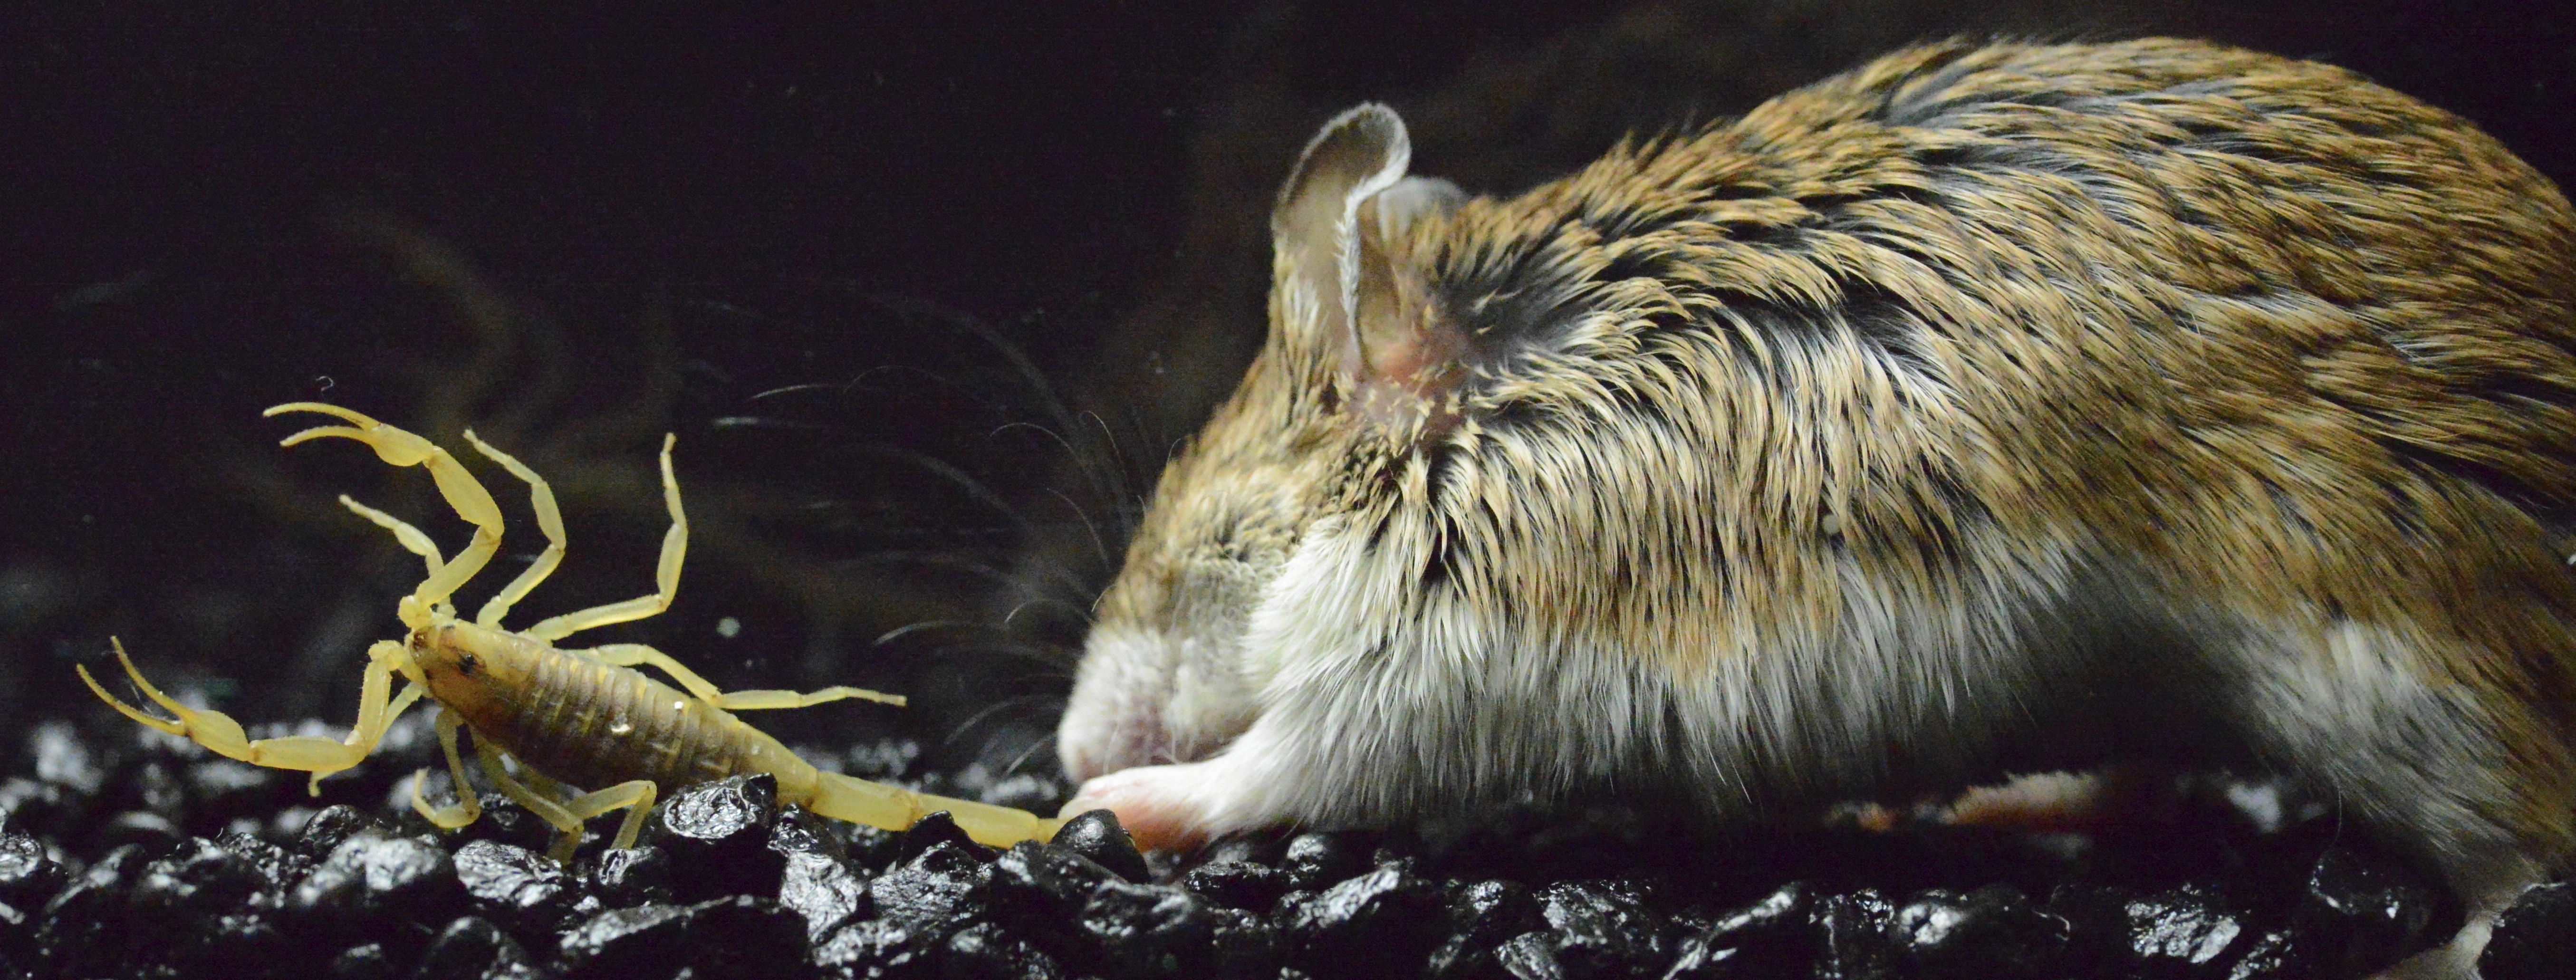
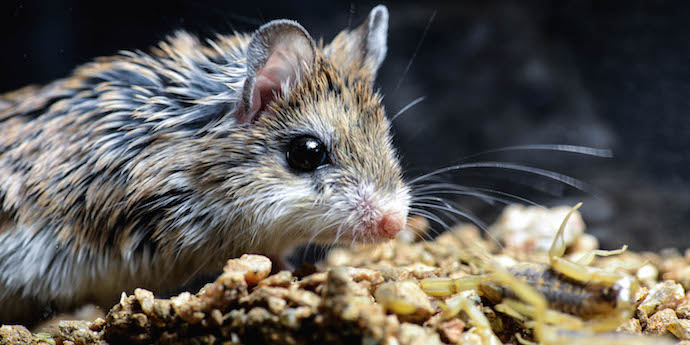
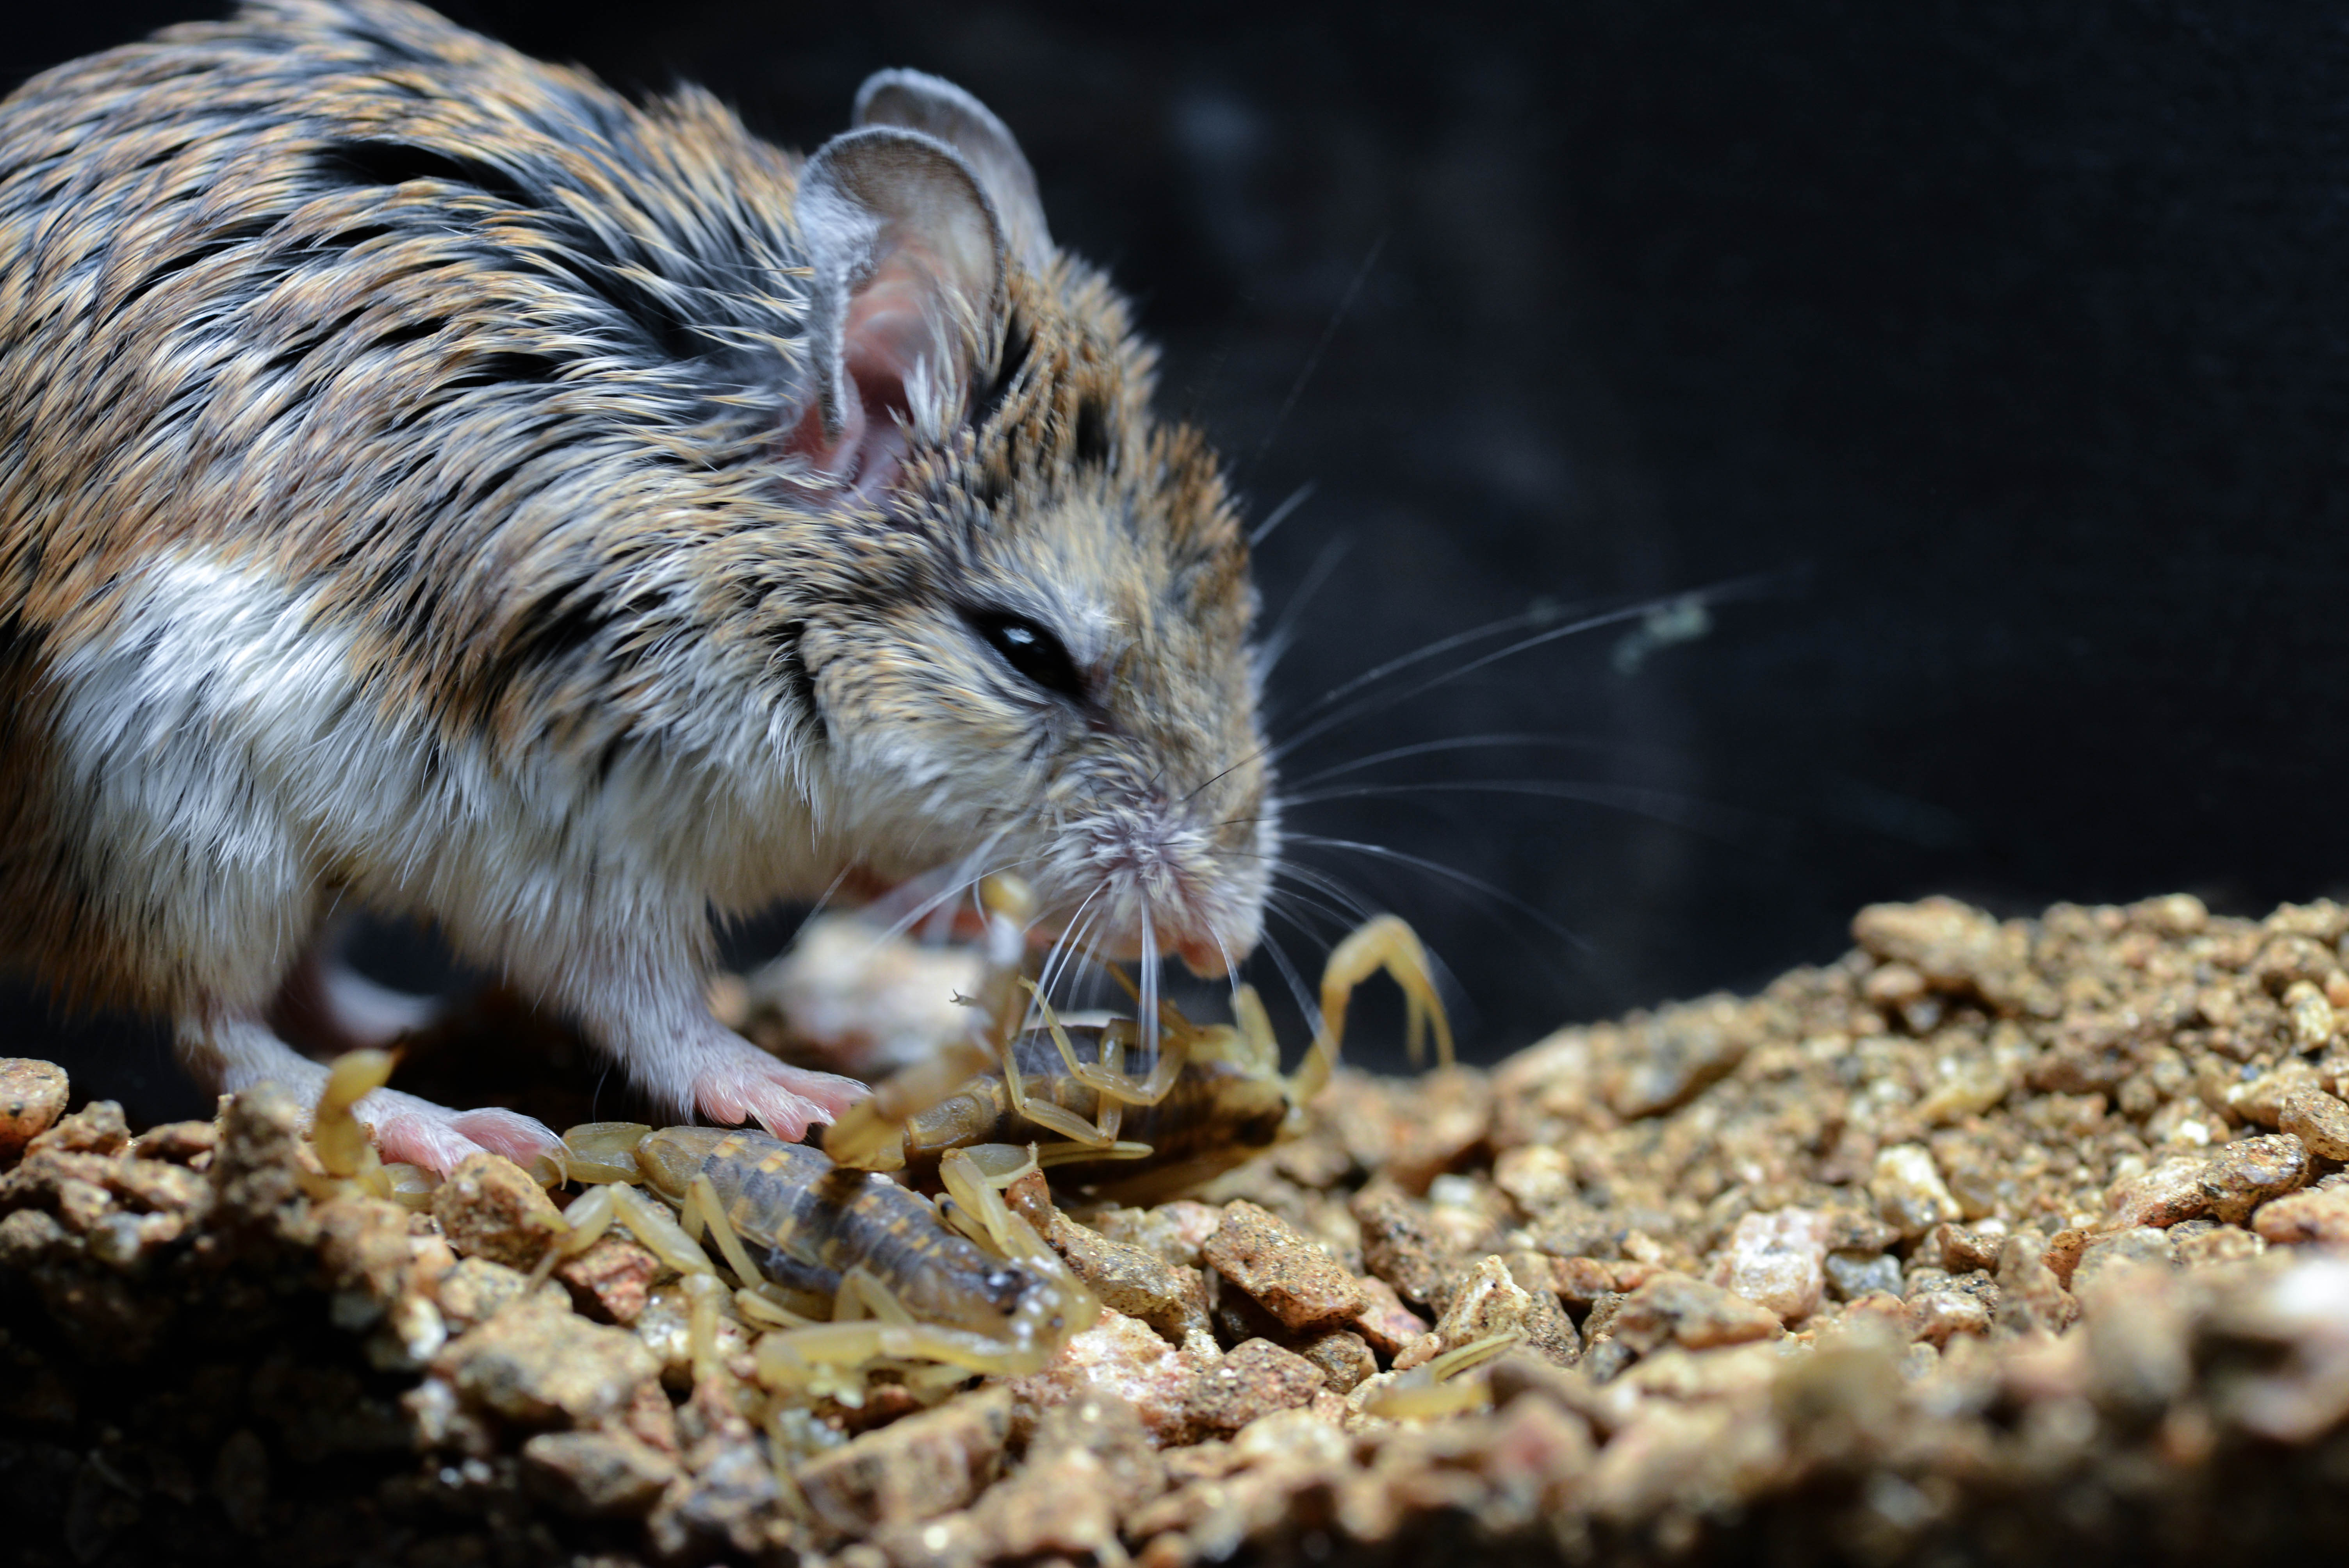
Images of the southern grasshopper mouse (Onychomys torridus) capturing and eating the painful species of scorpion (Centruroides sculpturatus).
Size differences of the two scorpions used in the experiments (painful Arizona bark scorpion, Centruroides sculpturatus is on the left; painless stripe-tailed scorpion, Hoffmannius spinigerus on the right)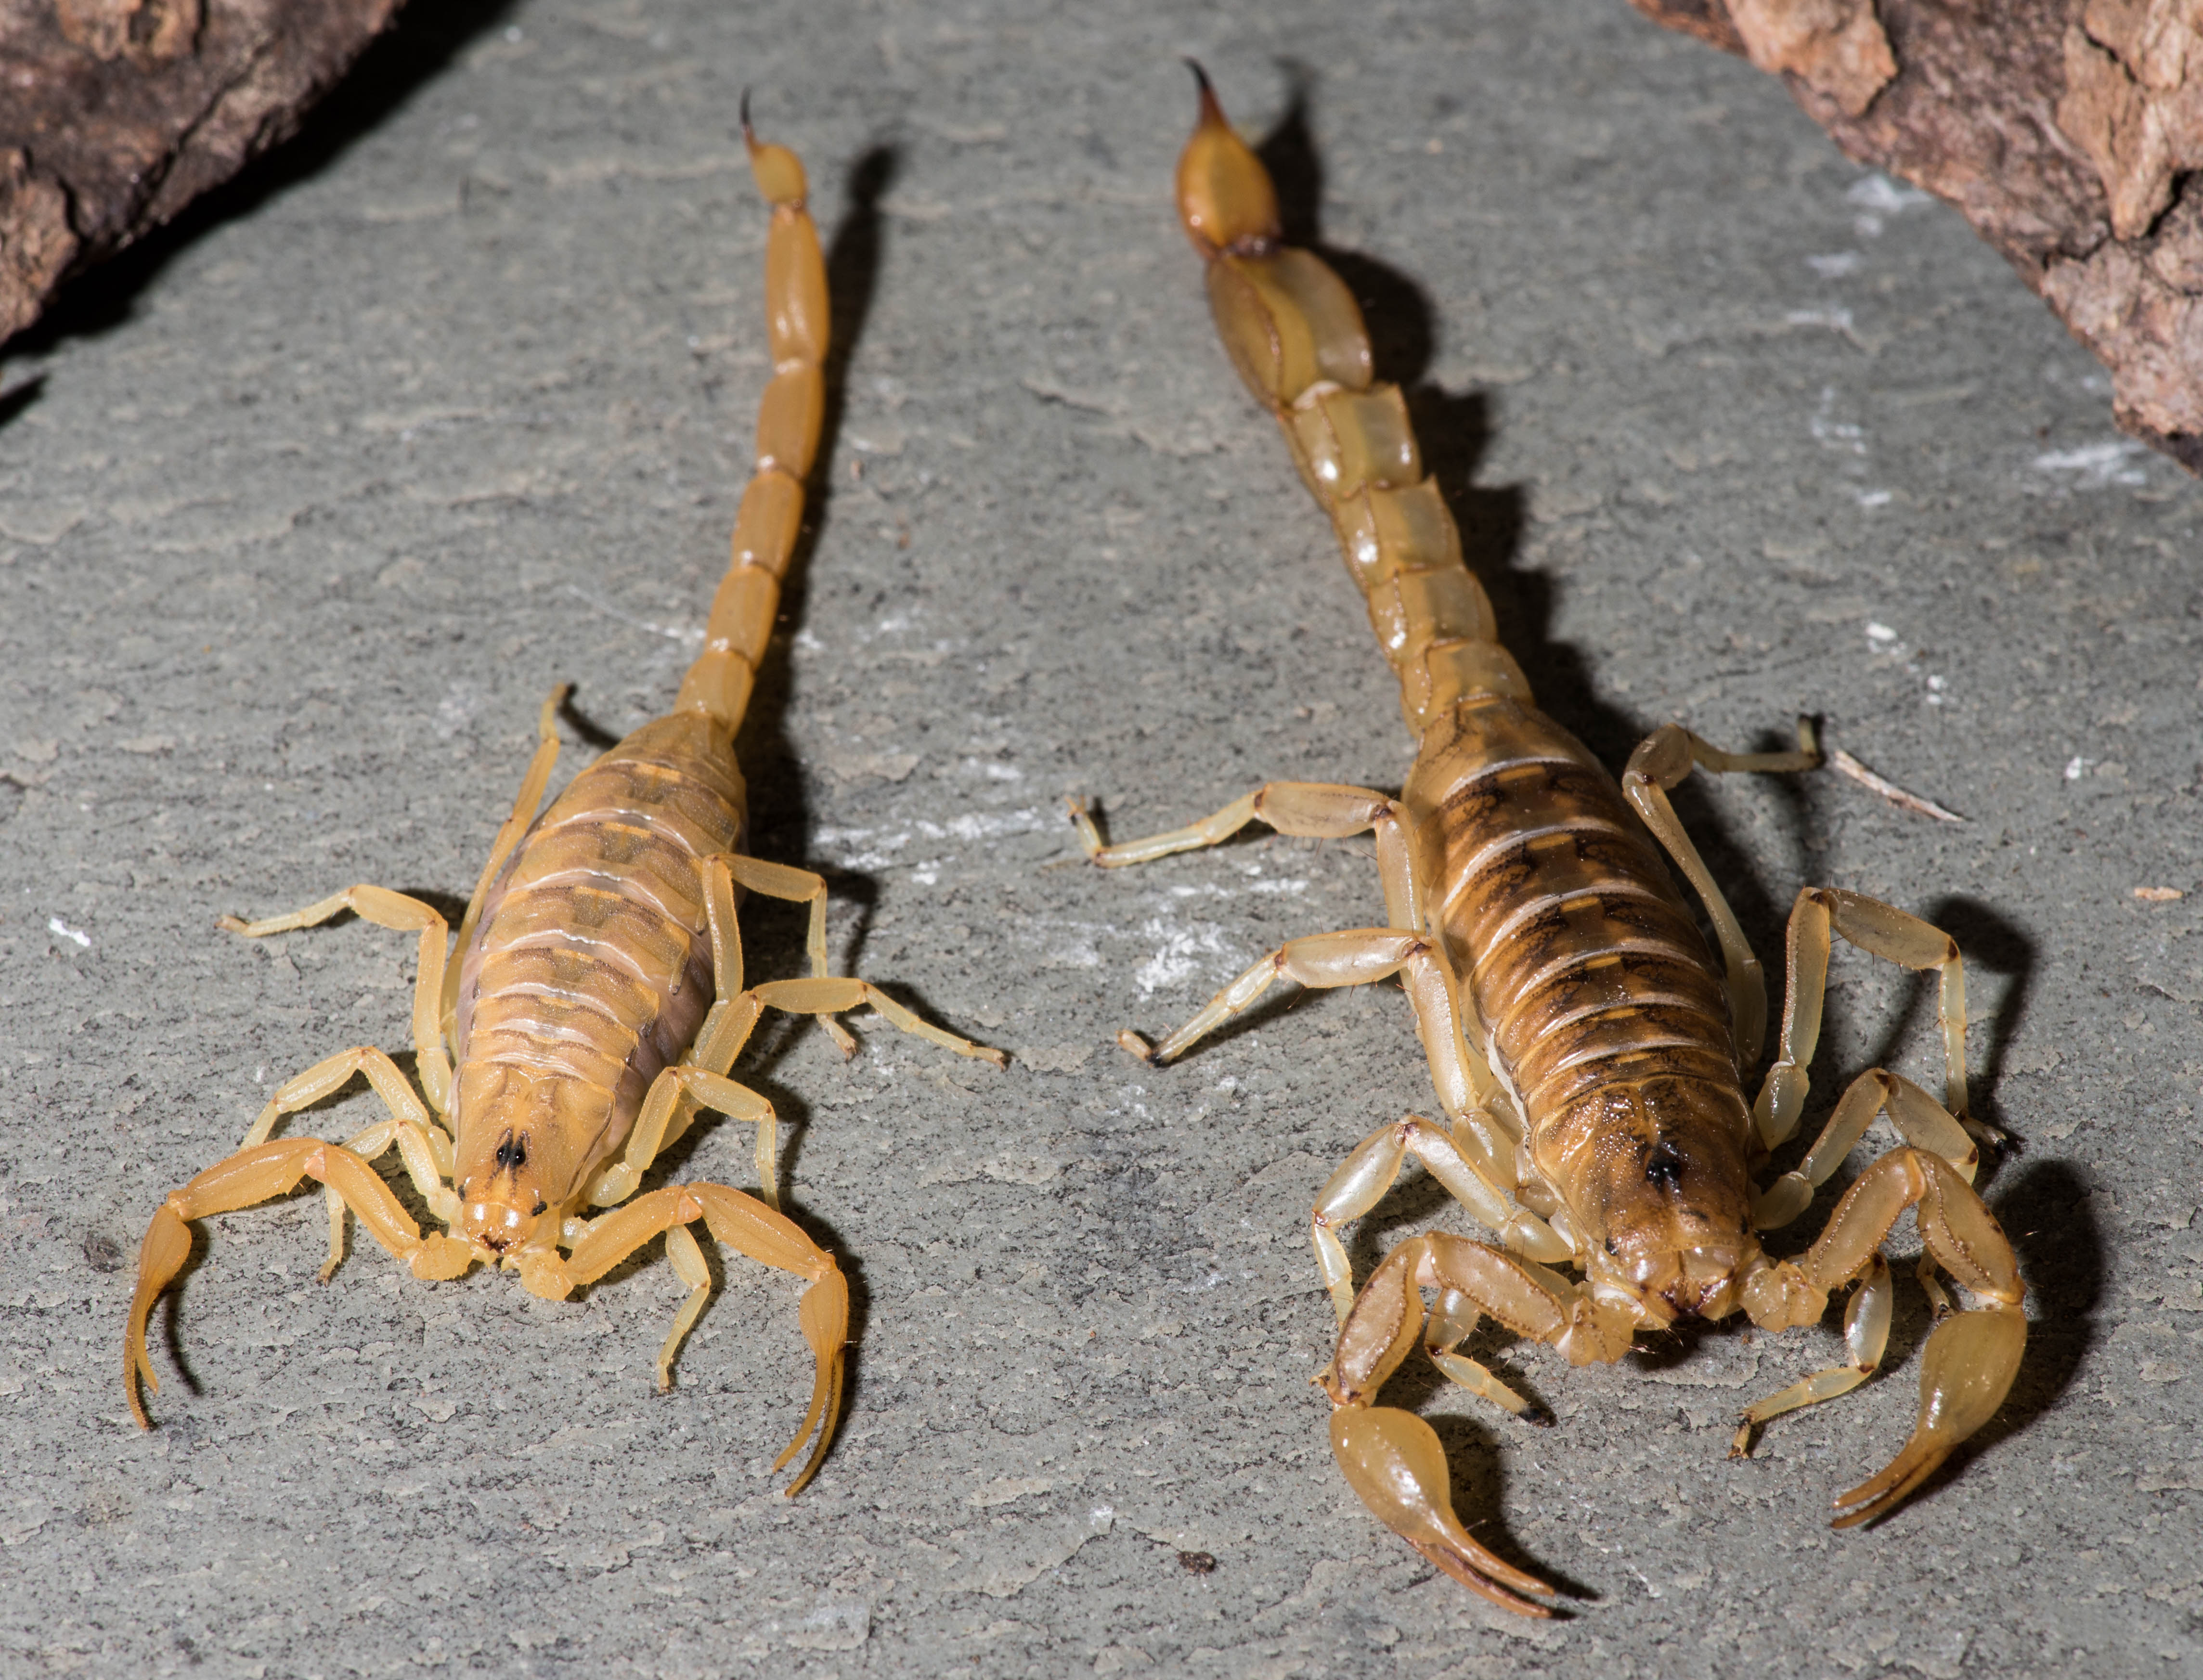
Featured scientists: Ashlee and Matt Rowe from University of Oklahoma
Undergraduate researchers involved with the project: Travis Tate and Crystal Niermann from Sam Houston State University; Rolando Barajas, Hope White, and Amber Suto from Michigan State University
Flesch–Kincaid Reading Grade Level = 7.1

Is there another means by which to get the video of the mouse attacking the scorpion? You Tube took it down for objectionable content
Yes! We spoke to Matt and Ashlee and they let us know a copy of this video is available through the Supplemental Materials of one of their published papers. You can find it here – https://science.sciencemag.org/content/suppl/2013/10/23/342.6157.441.DC1
Hi,
My students are going through the data nuggets and had a question about the data collected in the “Tail of Two Scorpions.” Why does the chart only show the approach, tip, attack, and consume data for the Painful variety of scorpion and not the painless?
Thanks
Thank you for your question! We actually had a version of this activity before where we gave both tables – we had a table showing the data for the painful scorpion, and a table for the painless. The table for the painless is in this case just the reverse of the painful. For example, if the mice chose painful species 1/6 times, this means that they chose the painless species 5/6 times. We presented it to teachers and they thought it was repetitive to have both tables so we took the second out. Let us know if you think it would be better to have both tables in instead!
Students that might benefit from reading level 2 will likely struggle with how the data is presented. Presenting only “1/2” of an either/or result (painful sting or not) at this level will be confusing for many students. Perhaps a double bar graph or a stacked bar graph (good way to introduce this type of graph!) that displays all data would be more interpretable. Students will also struggle with the related concepts of proportion and percentage – many students are explicitly taught that frequency or proportion is the decimal value of solving the fraction, whereas percentage is multiplying that number by 100. The DV unit is percentage but the values are proportion (or frequency).
Great suggestion! We incorporated those edits into the new draft here, let us know what you think!