The activities are as follows:
- Teacher Guide
- Student activity, Graph Type A, Level 2
- Student activity, Graph Type B, Level 2
- Student activity, Graph Type C, Level 2
- Grading Rubric
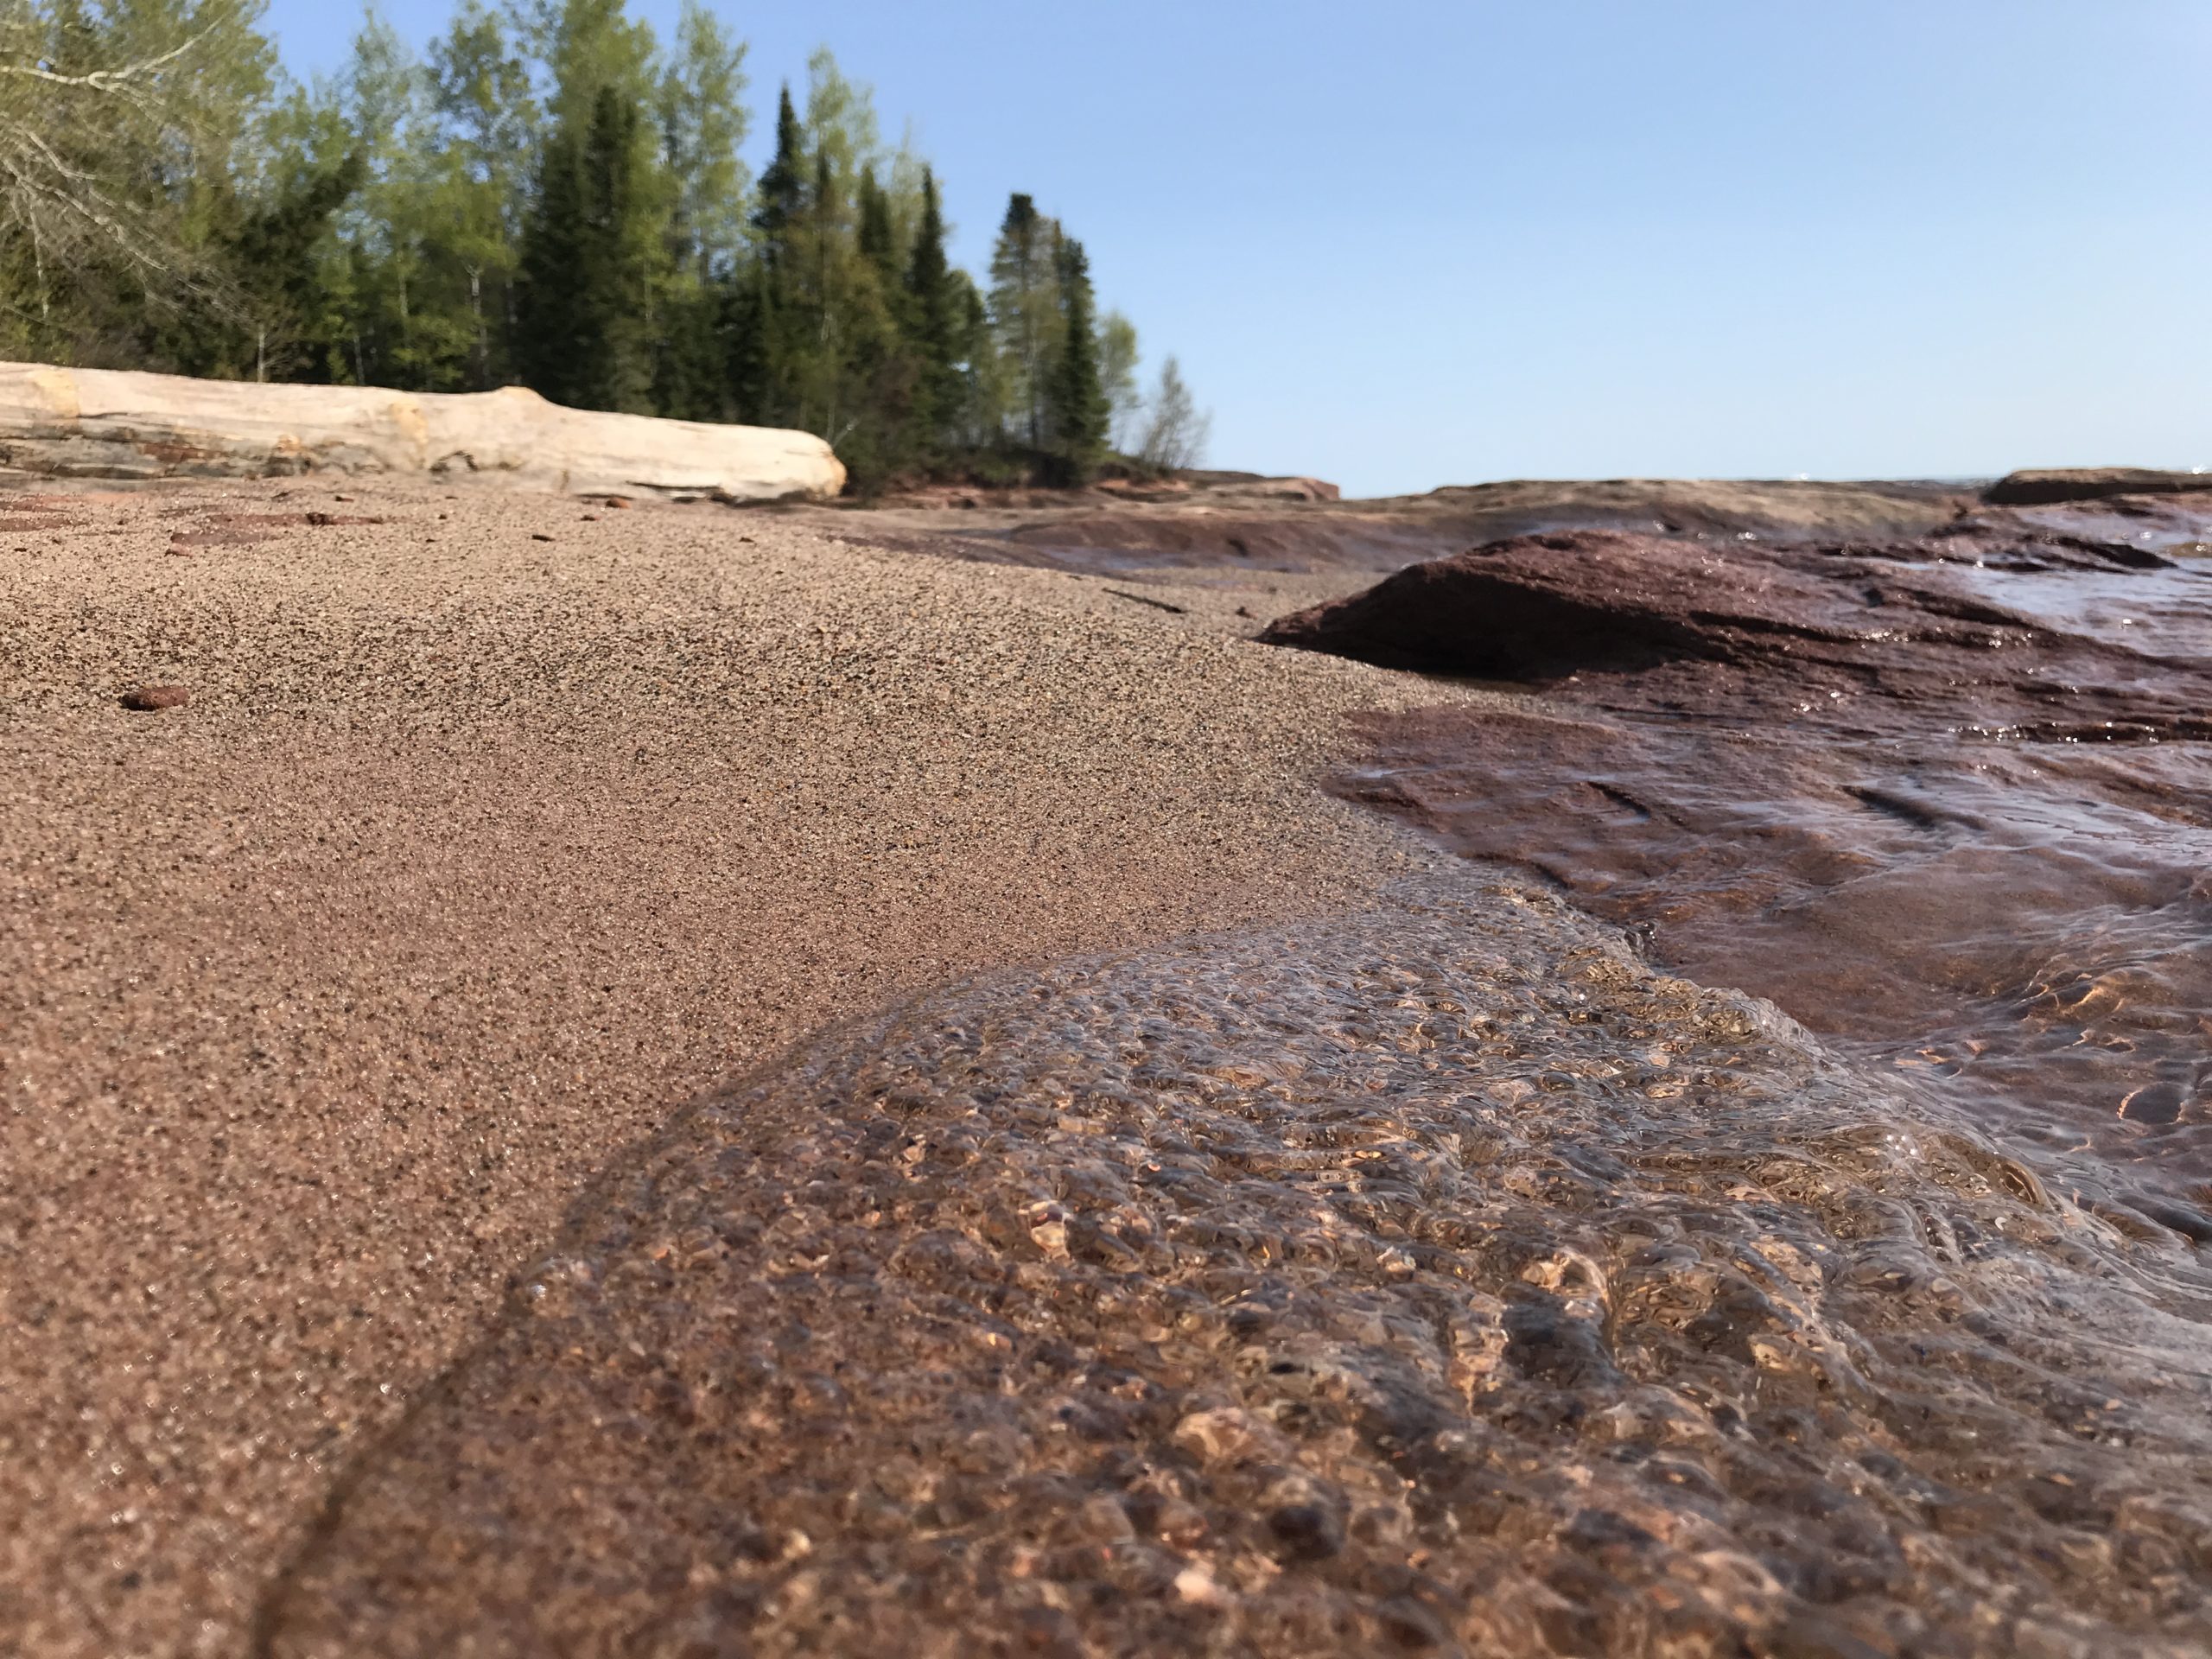
It’s a beach day! You’re walking through the sand on a southern California beach, looking for a place to put your things. You notice there are clumps of dried-up seaweed everywhere. As you brush aside some of these clumps to lay out your towel, a shrimp-like bug jumps out at you and bounces off your hand! With smelly dried seaweed, small birds skittering across the sand, and hopping bugs, you wonder, is this beach healthy? Yes! These are all parts of a thriving food web.
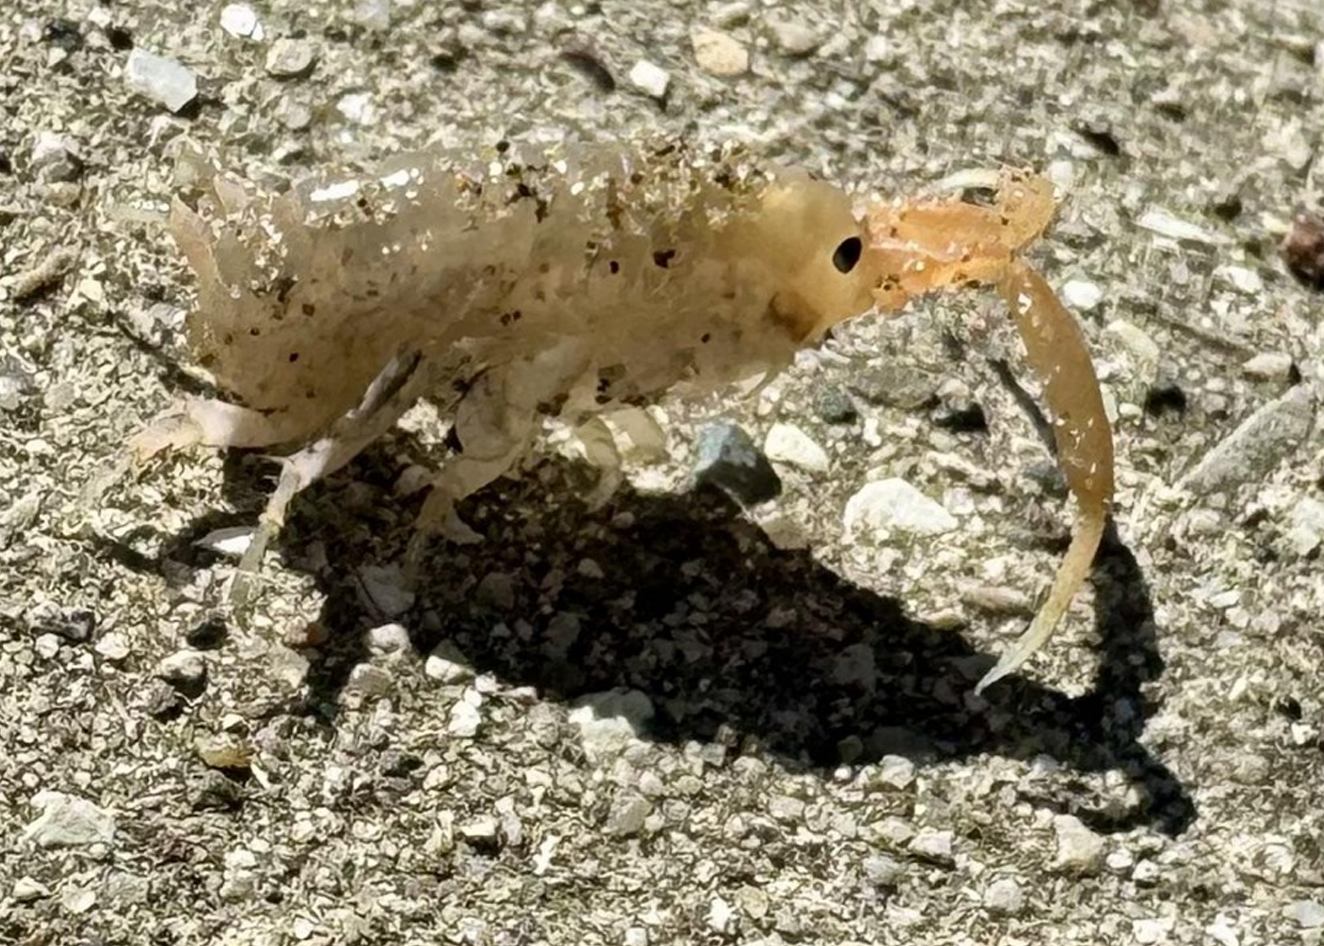
Beaches are home to many important species that each play a role in the ecosystem. On the Pacific Coast of California, the dried-up seaweed is typically made up of several species of kelp. Kelp captures the sun’s energy through photosynthesis. Beach hoppers, the little jumping “bugs”, are actually small crustaceans
that feed on the kelp. In turn, these beach hoppers are the main food source for birds.
Snowy plovers are a type of bird that loves to eat beach hoppers. This shorebird species is threatened in California due to habitat loss. The sandy beaches where the plovers live and nest are also places where people like to walk and play. Scientists want to better understand what makes up the base of the food web that supports plovers to help their populations recover.
High school seniors, Mari and Azra, visited beaches in Lompoc, a coastal city in California, many times with their science classes. They wanted to learn more about the sandy beach ecosystem, so they read an article from a local research group at the University of California-Santa Barbara. On one of their field trips, they learned about a scientist named Jenny Dugan. Jenny and members of her lab study the beach hoppers’ important role in the sandy beach ecosystem. The Dugan lab had done a series of experiments to see what types of kelp beach hoppers liked to eat.
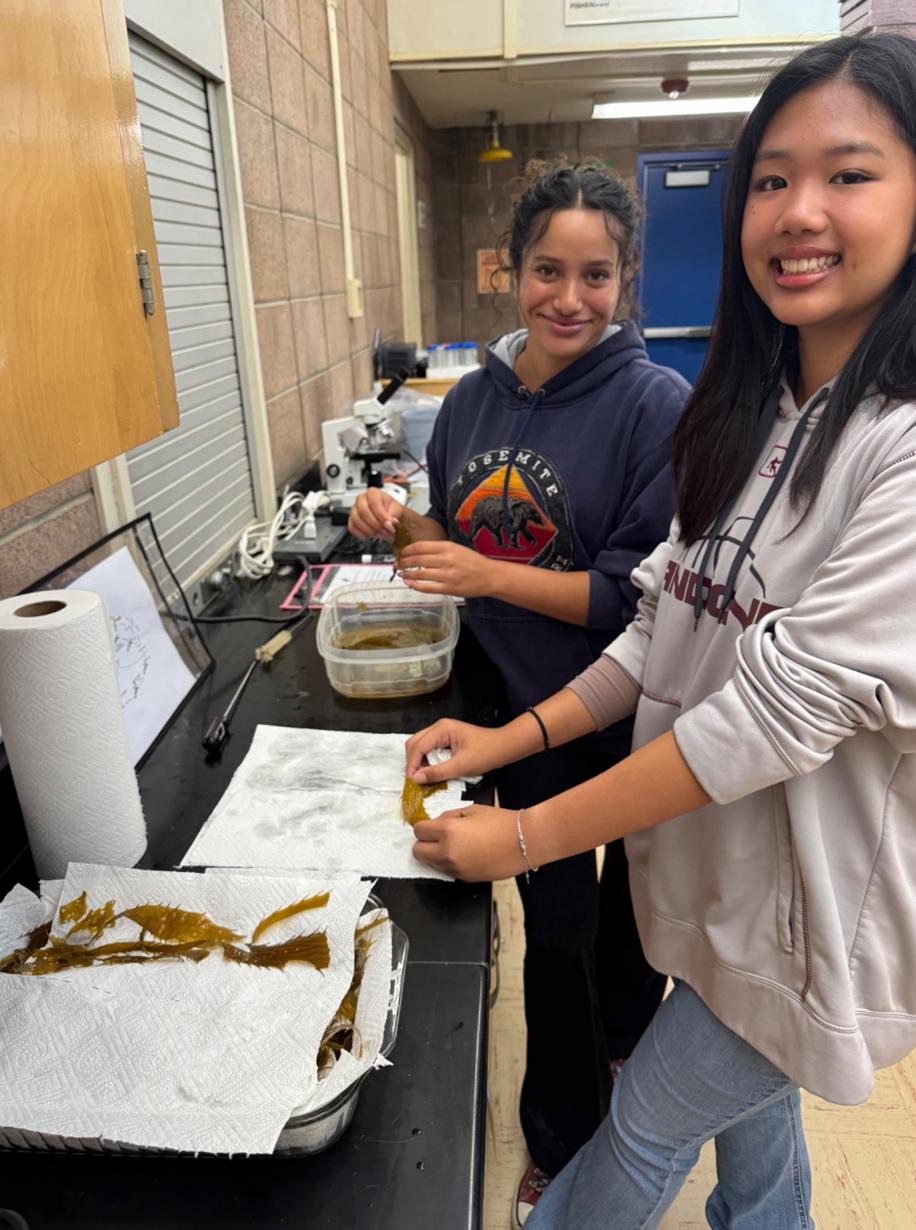
Mari and Azra wanted to set up a similar experiment to see if the beach hoppers in the Lompoc area preferred the same species of kelp. Their teacher, Ms. Moore, collected beach hoppers, sand, and kelp on her way to school one day. Mari and Azra set up ten plastic containers by measuring an equal amount of damp sand and punching holes in the lids. Then they tried to put 10 beach hoppers into the container. But it was hard to know the exact number until the very end of the experiment because some would hop out before the lid was on! At the end of the study, the number ranged from 8-15 beach hoppers in each container. Finally, Mari and Azra weighed out 15.0 grams of kelp and put it on top of the sand in the containers. They put one type of kelp in each container. Four containers had feather boa kelp, Egregia, four containers had giant kelp, Macrocystis, and two containers had Laminaria, another type of kelp. Mari and Azra also set up controls for each type of kelp with sand and kelp, but no beach hoppers. This container would tell them how much kelp weight was lost to water evaporation over the 3 days of the experiment, and not due to being eaten.
Trial 1: Mari and Azra placed the containers outside in a shady spot for three days. On the third morning, they opened up the containers to weigh the kelp that remained. Before weighing the kelp, they rinsed it to remove excess sand and dried it gently to remove excess water. Finally, they counted the beach hoppers that were in the container.
Trial 2: After reviewing their results from this experiment, Mari and Azra realized the beach hoppers did not like Laminaria at all. They decided to repeat the experiment using kelp and beach hoppers from a different beach, and did not include Laminaria as a food source.

Featured scientists: Mari and Azra from Lompoc High School, California. Jenny Dugan from the University of California-Santa Barbara. Written by: Melissa Moore from Lompoc High School.