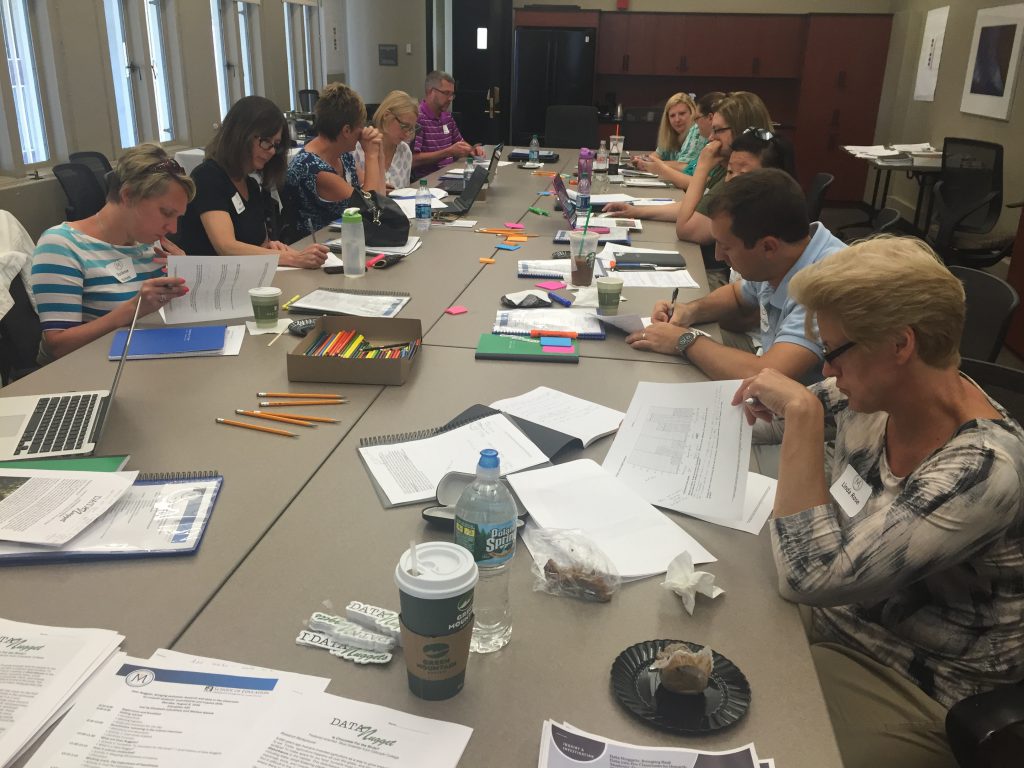
Do Data Nuggets align with your teaching goals, and you want to learn more about how to use them in your classroom? Are you interested in making a Data Nugget of your own?
We offer remote and on-site training opportunities that can be targeted towards your goals, such as improving your broader impacts by helping communicate your research to a broad audience, or help you use Data Nuggets most effectively with your students.
Potential topics covered include:
- quantitative reasoning in the classroom
- how to represent the authentic process of science in the classroom
- hypotheses and how to address misconceptions
- exploring data with statistics and graphing
- constructing explanations using evidence
- getting students to ask scientific questions
- what are Data Nuggets and how to get the most out of them
- how to create your own Data Nugget to fulfill broader impacts and science communication
We’d be happy to present to your group! Workshops range in cost depending on duration, number of attendees, and whether the offering is given in person or virtually. Please let us know your situation and depending on the circumstances, we can try to arrange a training opportunity that is feasible for us and you! Please send your training workshop requests and ideas to datanuggetsk16@gmail.com!
Materials from:
- Michigan Science Teacher’s Association – March 25, 2017
- Kellogg Biological Summer Institute – August 18, 2016
- Kalamazoo Public Schools Back to School Professional Development – August 30, 2016
Advice on how to use the Claim-Evidence-Reasoning framework in your classroom intentionally. Session presented with two Michigan science teachers, Marcia Angle and Cheryl Hach.
Session Description: In our session we will talk about the transition of science education away from memorization of facts and more towards the application of applying critical thinking and quantitative reasoning. We will discuss the importance of scaffolding student learning centered on the scientific principles of investigation, student discourse, and will unveil our new graphic CER organizer that we designed to support student writing when it comes to Claim, Evidence and the oh so difficult Reasoning portions of science writing. We use Data Nuggets throughout the session to model how you can integrate our CER tool into the classroom and increase the amount of data analysis and interpretation done in your classroom. This session is for upper elementary, middle and high school teachers whose students struggle with quantitative skills and CER writing. Our little nuggets can do great things!
- Workshop slides
- Claims-Evidence-Reasoning Writing Tool
- Revised Rubric
- Example Student Responses for “Won’t you be my urchin?” Data Nugget
Materials from NY Master Teacher PD in Albany – August 8, 2016
Want to involve your students in cutting edge science research without even leaving the classroom? Data Nuggets are an innovative approach to connect students with scientists and authentic data. These free activities reveal how the process of science actually works and give students practice interpreting quantitative information and making evidence based claims. Data Nuggets are aligned with the Next Generation Science Standards, Vision and Change, and AP Biology standards.
In this workshop we will demonstrate how to use our current Data Nugget resources in the classroom. We will take an in depth look at the big themes present in these activities, including distinguishing hypotheses from predictions, using claim-evidence-reasoning structure to help students construct explanations, and modeling the process of science followed in real research. Finally, we will share our exciting plans for testing the efficacy of Data Nuggets at increasing student quantitative literacy, understanding of science, and motivation to pursue careers in science.
- Workshop slides
- Data Nugget publication – Schultheis & Kjelvik 2015
- Quantitative Reasoning (QR) Teacher Scenarios
- Process of Science Flowchart
- Sexy Smells and Shoot the Poop hypotheses underlined
- Hypothesis publication – Strode 2015
- Constructing explanations (CER) tool
- Graphing Guide

