Changing climates in the Rocky Mountains

Lower elevation site in the Rocky Mountains: Temperate conifer forest. Photo Credit: Alice Stears.

The activities are as follows:

Each type of plant needs specific conditions to grow and thrive. If conditions change, such as temperature or the amount of precipitation, plant communities may change as well. For example, as the climate warms, plant species might start to shift to higher latitudes to follow the conditions where they grow best. But what if a species does well in cold climates found at the tops of mountains? Because they have nowhere to go, warming puts that plant species at risk.  

To figure out if species are moving, we need to know where they’ve lived in the past, and if climates are changing. One way that we can study both things is to use the Global Vegetation Project. The goal of this project is to curate a global database of plant photos that can be used by educators and students around the world. Any individual can upload photos and identify plant species. The project then connects each photo to information on the location’s biome, ecoregion, and climate, including data tracking precipitation and temperature over time. The platform can also be used to explore how the climates of different regions are changing and use that information to predict how plant communities may change. 

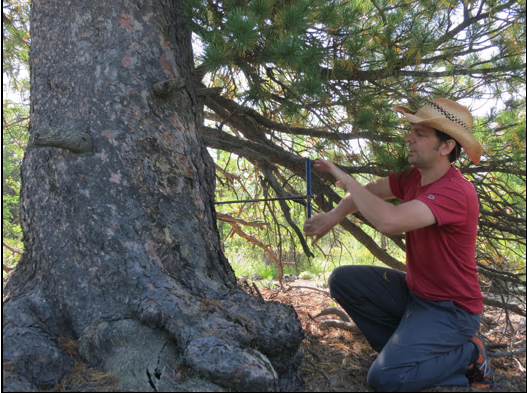
Daniel is a scientist who is interested in sharing the Global Vegetation Project data with students. Daniel became interested in plants and vegetation when he learned in college that you can simply walk through the woods and prairie, collect wild seeds, germinate the plants, and grow them to restore degraded landscapes. Plants set the backdrop for virtually every landscape that we see. He thinks plants deserve our undivided attention.

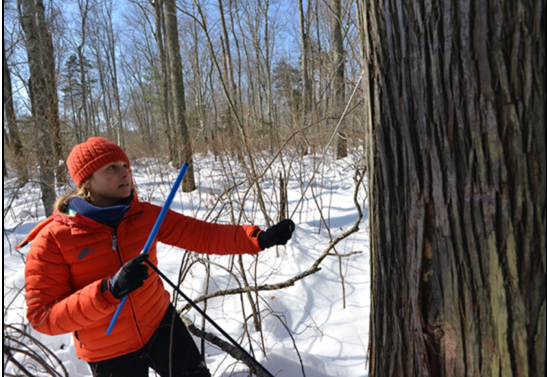
Daniel and his team wanted to create a resource where students can look deeper into plant communities and their climates. Much of the inspiration for the Global Vegetation Project came from the limitations to undergraduate field research during the COVID-19 pandemic. Students in ecology and botany classes, who would normally observe and study plants in the field, were prevented from having these opportunities. By building an online database with photos of plants, students can explore local plants without having to go into the field and can even see plants from faraway places. 

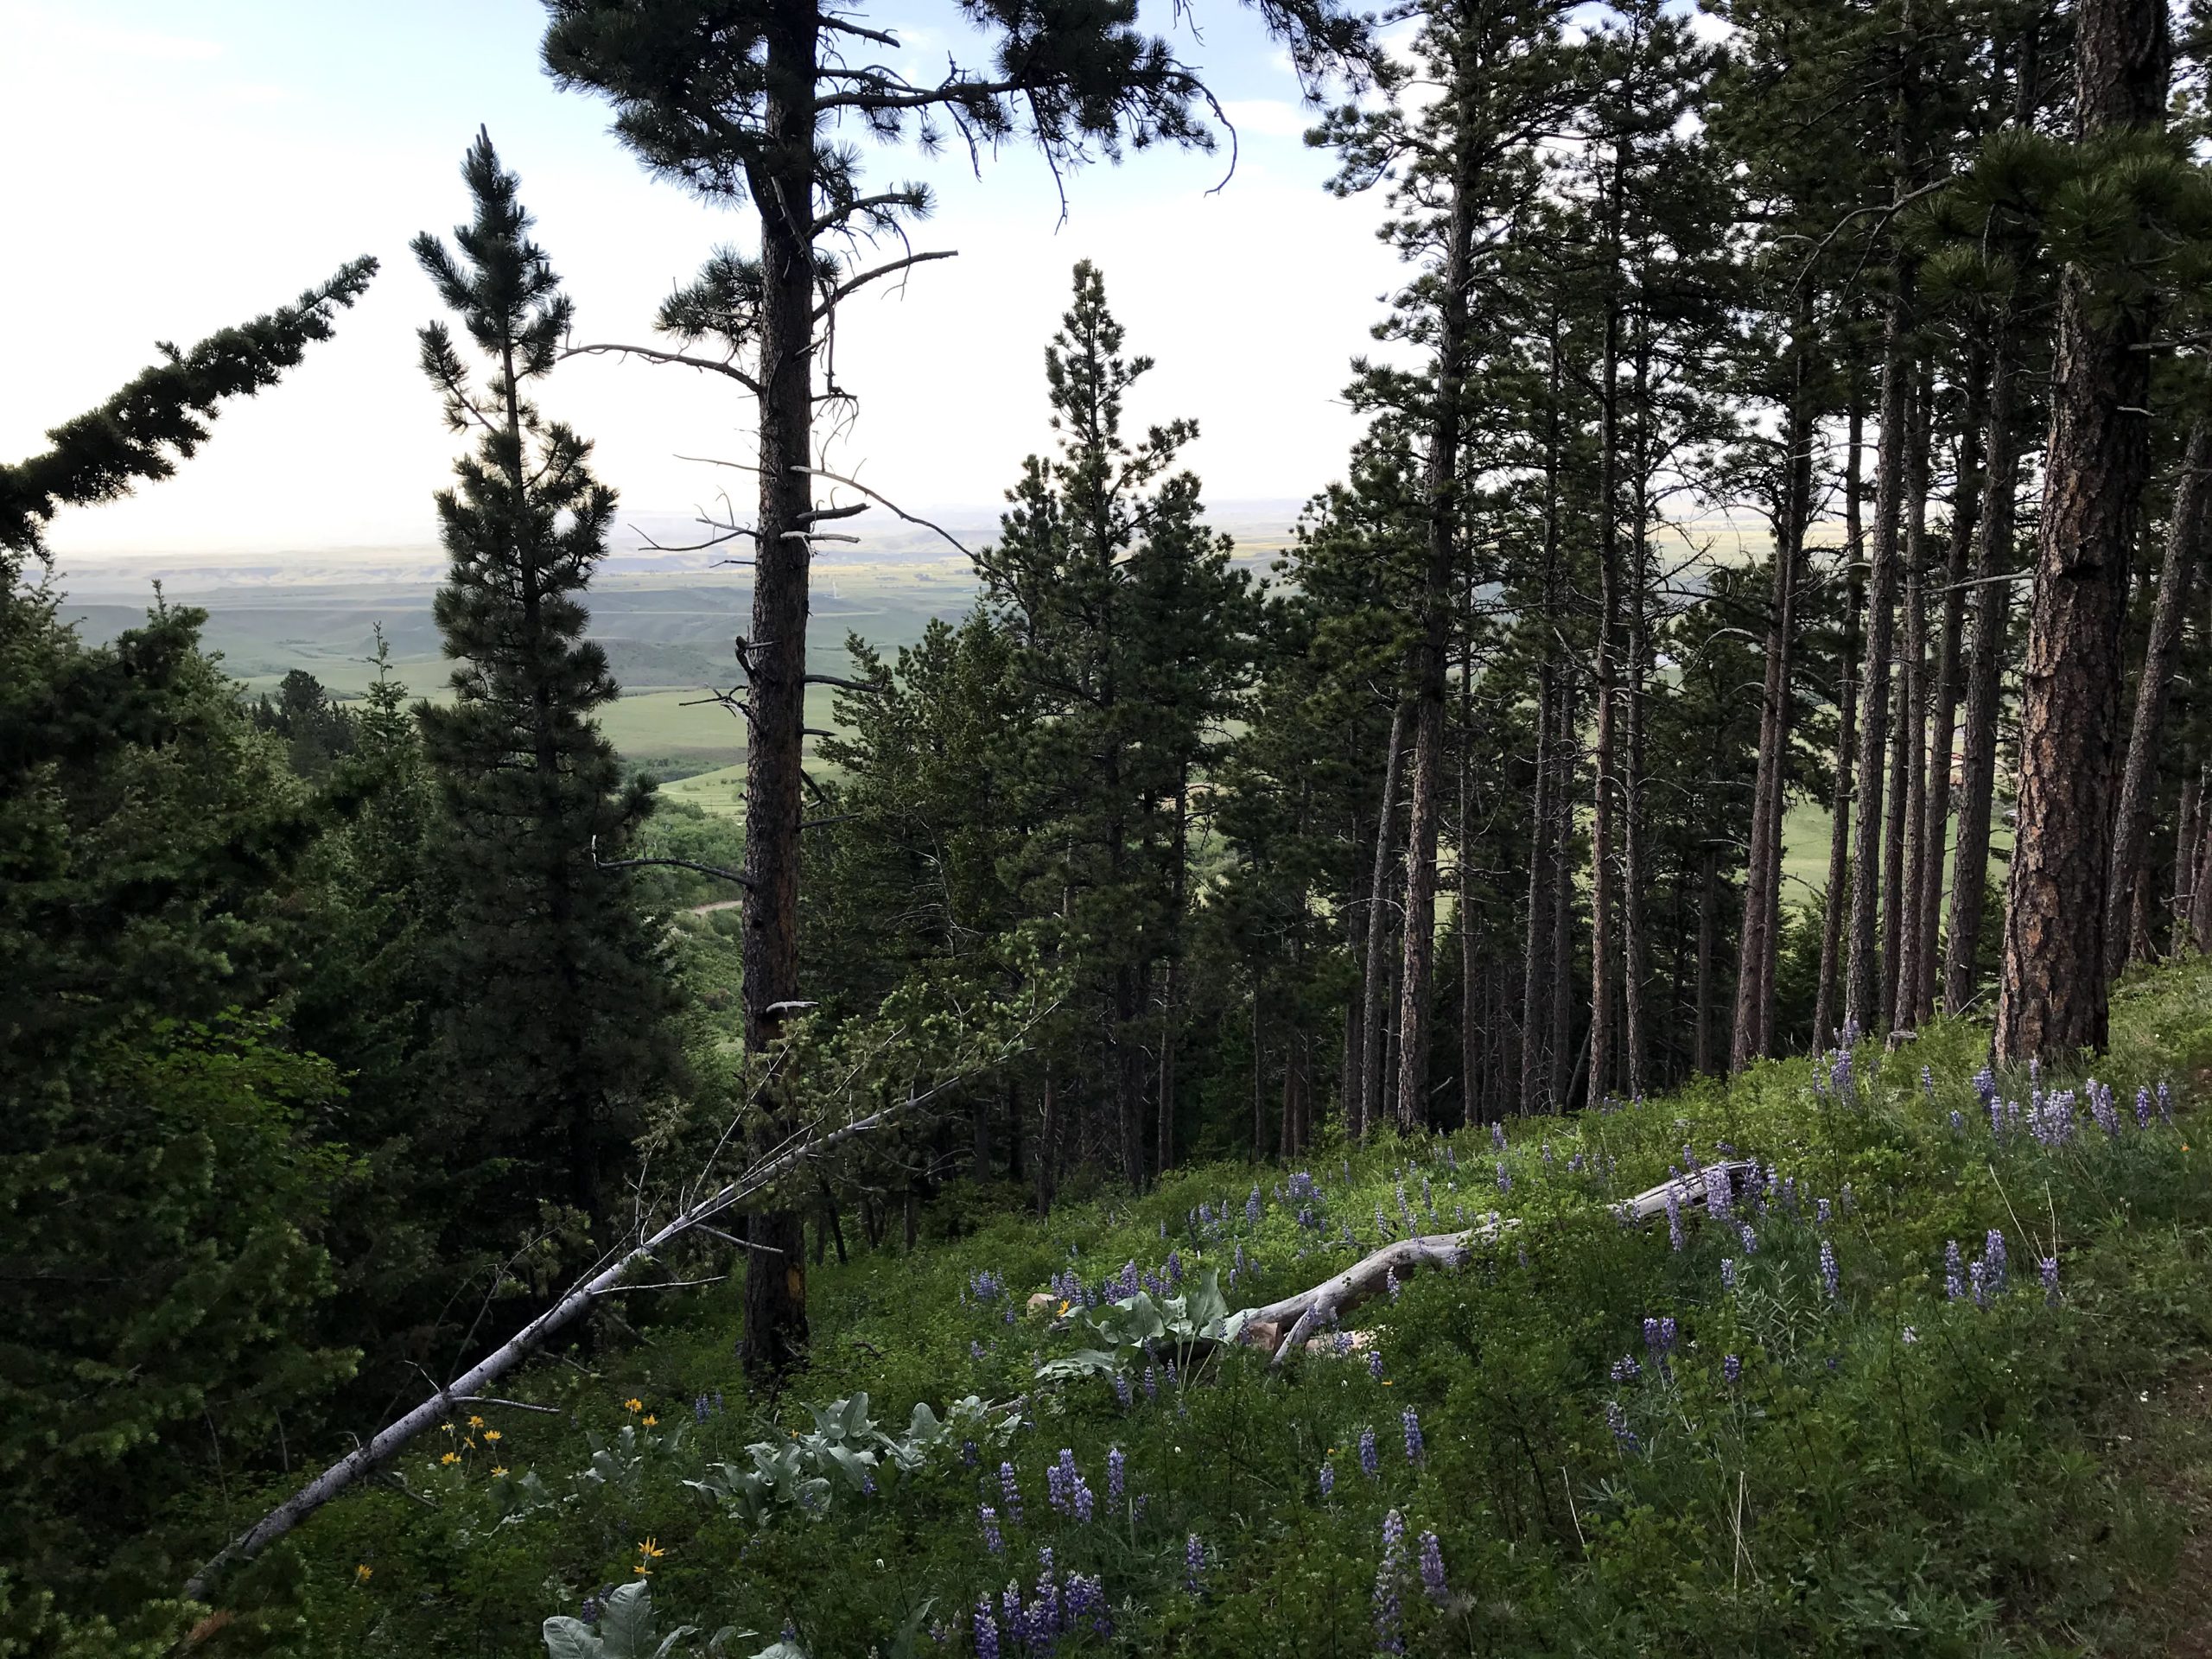
Daniel’s lab is based in the Rocky Mountains in Wyoming, where the plants are a showcase in both biodiversity and beauty. These communities deal with harsh conditions: cold, windy and snowy winters, hot and dry summers, and unpredictable weather during spring and fall. The plants rely on winter snow slowly melting over spring and into summer, providing moisture that can help them survive the dry summers. 

The Rocky Mountains are currently facing many changes due to climate change, including drought, increased summer temperatures, wildfires, and more. This creates additional challenges for the plants of the Rockies. Drought reduces the amount of precipitation, decreasing the amount of water available to plants. In addition, warmer temperatures in winter and spring shift more precipitation to rain instead of snow and melts snow more quickly. Rain and melted snow rapidly move through the landscape, becoming less available to plants in need. On top of all this, hotter, drier summers further decrease the amount of water available, stressing plants in an already harsh environment. If these trends continue, there could be significant impact on the types of plants that are able to grow in the Rocky Mountains. These changes will have an impact on the landscape, organisms that rely on plants, and humans as well.

Daniel and his colleagues pulled climate data from a Historic period (1961-2009) and Current period (2010-2018). They selected two locations in Wyoming to focus on: a lower elevation montane forest and a higher elevation site. To study climate, they focused on temperature and precipitation because they are important for plants. They wanted to study how temperature and precipitation patterns changed overall and how they changed in different seasons. They predicated temperatures would be higher in the Current period compared to the Historic period in both locations. For precipitation, they predicted there would be drier summers and wetter springs.

Featured scientist: Daniel Laughlin from The University of Wyoming. Written by: Matt Bisk.

Flesch–Kincaid Reading Grade Level = 10.5

Additional teacher resource related to this Data Nugget:

A window into a tree’s world

Neil taking a tree core from a pine tree.

The activities are as follows:

According to National Aeronautics and Space Administration (NASA) and the National Oceanic Atmospheric Administration (NOAA), the years 2015-2018 were the warmest recorded on Earth in modern times! And it is only expected to get warmer. Temperatures in the Northeastern U.S. are projected to increase 3.6°F by 2035. Every year the weather is a bit different, and some years there are more extremes with very hot or cold temperatures. Climate gives us a long-term perspective and is the average weather, including temperature and precipitation, over at least 30 years. 

Over thousands of years, tree species living in each part of the world have adapted to their local climate. Trees play an important role in climate change by helping cool the planet – through photosynthesis, they absorb carbon dioxide from the atmosphere and evaporate water into the air. 

Scientists are very interested in learning how trees respond to rapidly warming temperatures. Luckily, trees offer us a window into their lives through their growth rings. Growth rings are found within the trunk, beneath the bark. Each year of growth has two parts that can be seen: a light ring of large cells with thin walls, which grows in the spring; and a dark layer of smaller cells with thick walls that forms later in the summer and fall. Ring thickness is used to study how much the tree has grown over the years. Dendrochronology is the use of these rings to study trees and their environments.

Different tree species have different ranges of temperatures and rainfall in which they grow best. When there are big changes in the environment, tree growth slows down or speeds up in response. Scientists can use these clues in tree’s rings to decipher what climate was like in the past. There is slight variation in how each individual tree responds to temperature and rainfall. Because of this, scientists need to measure growth rings of multiple individuals to observe year-to-year changes in past climate.

Jessie taking a tree core in the winter.

Jessie and Neil are two scientists who use tree rings for climate research. Jessie entered the field of science because she was passionate about climate change. As a research assistant, Neil saw that warming temperatures in Mongolia accelerated growth in very old Siberian pine trees. When he later studied to become a scientist, he wanted to know if trees in the eastern U.S. responded to changes in climate in the same way as the old pine trees in Mongolia. As a result, there were two purposes for Jessie’s and Neil’s work. They wanted to determine if there was a species that could be used to figure out what the climate looked like in the past, and understand how it has changed over time.

Jessie and Neil decided to focus on one particular species of tree – the Atlantic white cedar. Atlantic white cedar grow in swamps and wetlands along the Atlantic and Gulf coasts from southern Maine to northern Florida. Atlantic white cedar trees are useful in dendrochronology studies because they can live for up to 500 years and are naturally resistant to decay, so their well-preserved rings provide a long historical record. Past studies of this species led them to predict that in years when the temperature is warmer, Atlantic white cedar rings will be wider. If this pattern holds, the thickness of Atlantic white cedar rings can be used to look backwards into the past climate of the area. 

To test this prediction, Jessie and Neil needed to look at tree rings from many Atlantic white cedar trees. Jessie used an increment borer, a specialized tool that drills into the center of the tree. This drill removes a wood core with a diameter about equal to that of a straw. She sampled 112 different trees from 8 sites, and counted the rings to find the age of each tree. She then crossdated the wood core samples. Crossdating is the process of comparing the ring patterns from many trees in the same area to see if they tell the same story. Jessie used a microscope linked to a computer to measure the thickness of both the early and late growth to the nearest micrometer (1 micrometer = 0.001 millimeter) for all rings in all 112 trees. From those data she then calculated the average growth of Atlantic white cedar for each year to create an Atlantic white cedargrowth index for the Northeastern U.S. She combined her tree ring data with temperature data from the past 100 years.

Featured scientists: Jessie K Pearl, University of Arizona and Neil Pederson, Harvard University. Written by Elicia Andrews.

Flesch–Kincaid Reading Grade Level = 9.9

Suggestions for inquiry surrounding this Data Nugget:

These videos, demonstrating the science of dendrochronology, could be a great way to spark class discussions: