Superior watersheds: investigating stream health

Will sampling macroinvertebrates from a stream using a D net.

Fresh water is one of our most important natural resources and an essential daily need for all people. Ten percent of the world’s freshwater is in Lake Superior. It is the largest lake in the world by surface area. It is also one of the cleanest, clearest, and coldest lakes in the United States. 

Watersheds are the network of rivers and streams, called tributaries, that flow into a single point and empty into a larger body of water. The water at the end of a watershed therefore reflects all the changes that happened across a large area. Thousands of tributaries flow through forests, wetlands, and farmland before reaching Lake Superior. These tributaries carry soil, nutrients, and any pollution from the land into the lake.

For a long time, people living near Lake Superior assumed that the tributaries had good water quality, but they didn’t have data to support this. In 2002, some residents living along the lake’s southern shore in Wisconsin came together to monitor the health of local tributaries themselves. They were already hearing how climate change, pollution, and land use were affecting water systems around the world. They formed an organization, now called Superior Rivers Watershed Association (SRWA) to collect long-term data so they could track changes in local tributaries.

SRWA volunteer sorting through macroinvertebrates from a stream sample.

Today, over 20 years later, SRWA has an established monitoring program. Members train volunteers to visit streams and rivers to collect data. Through these volunteers, SRWA has data on over 50 tributaries in the Lake Superior watershed. They collect data on both the water chemistry of the tributaries, as well as the life they find there. This helps them understand how water conditions affect organisms. 

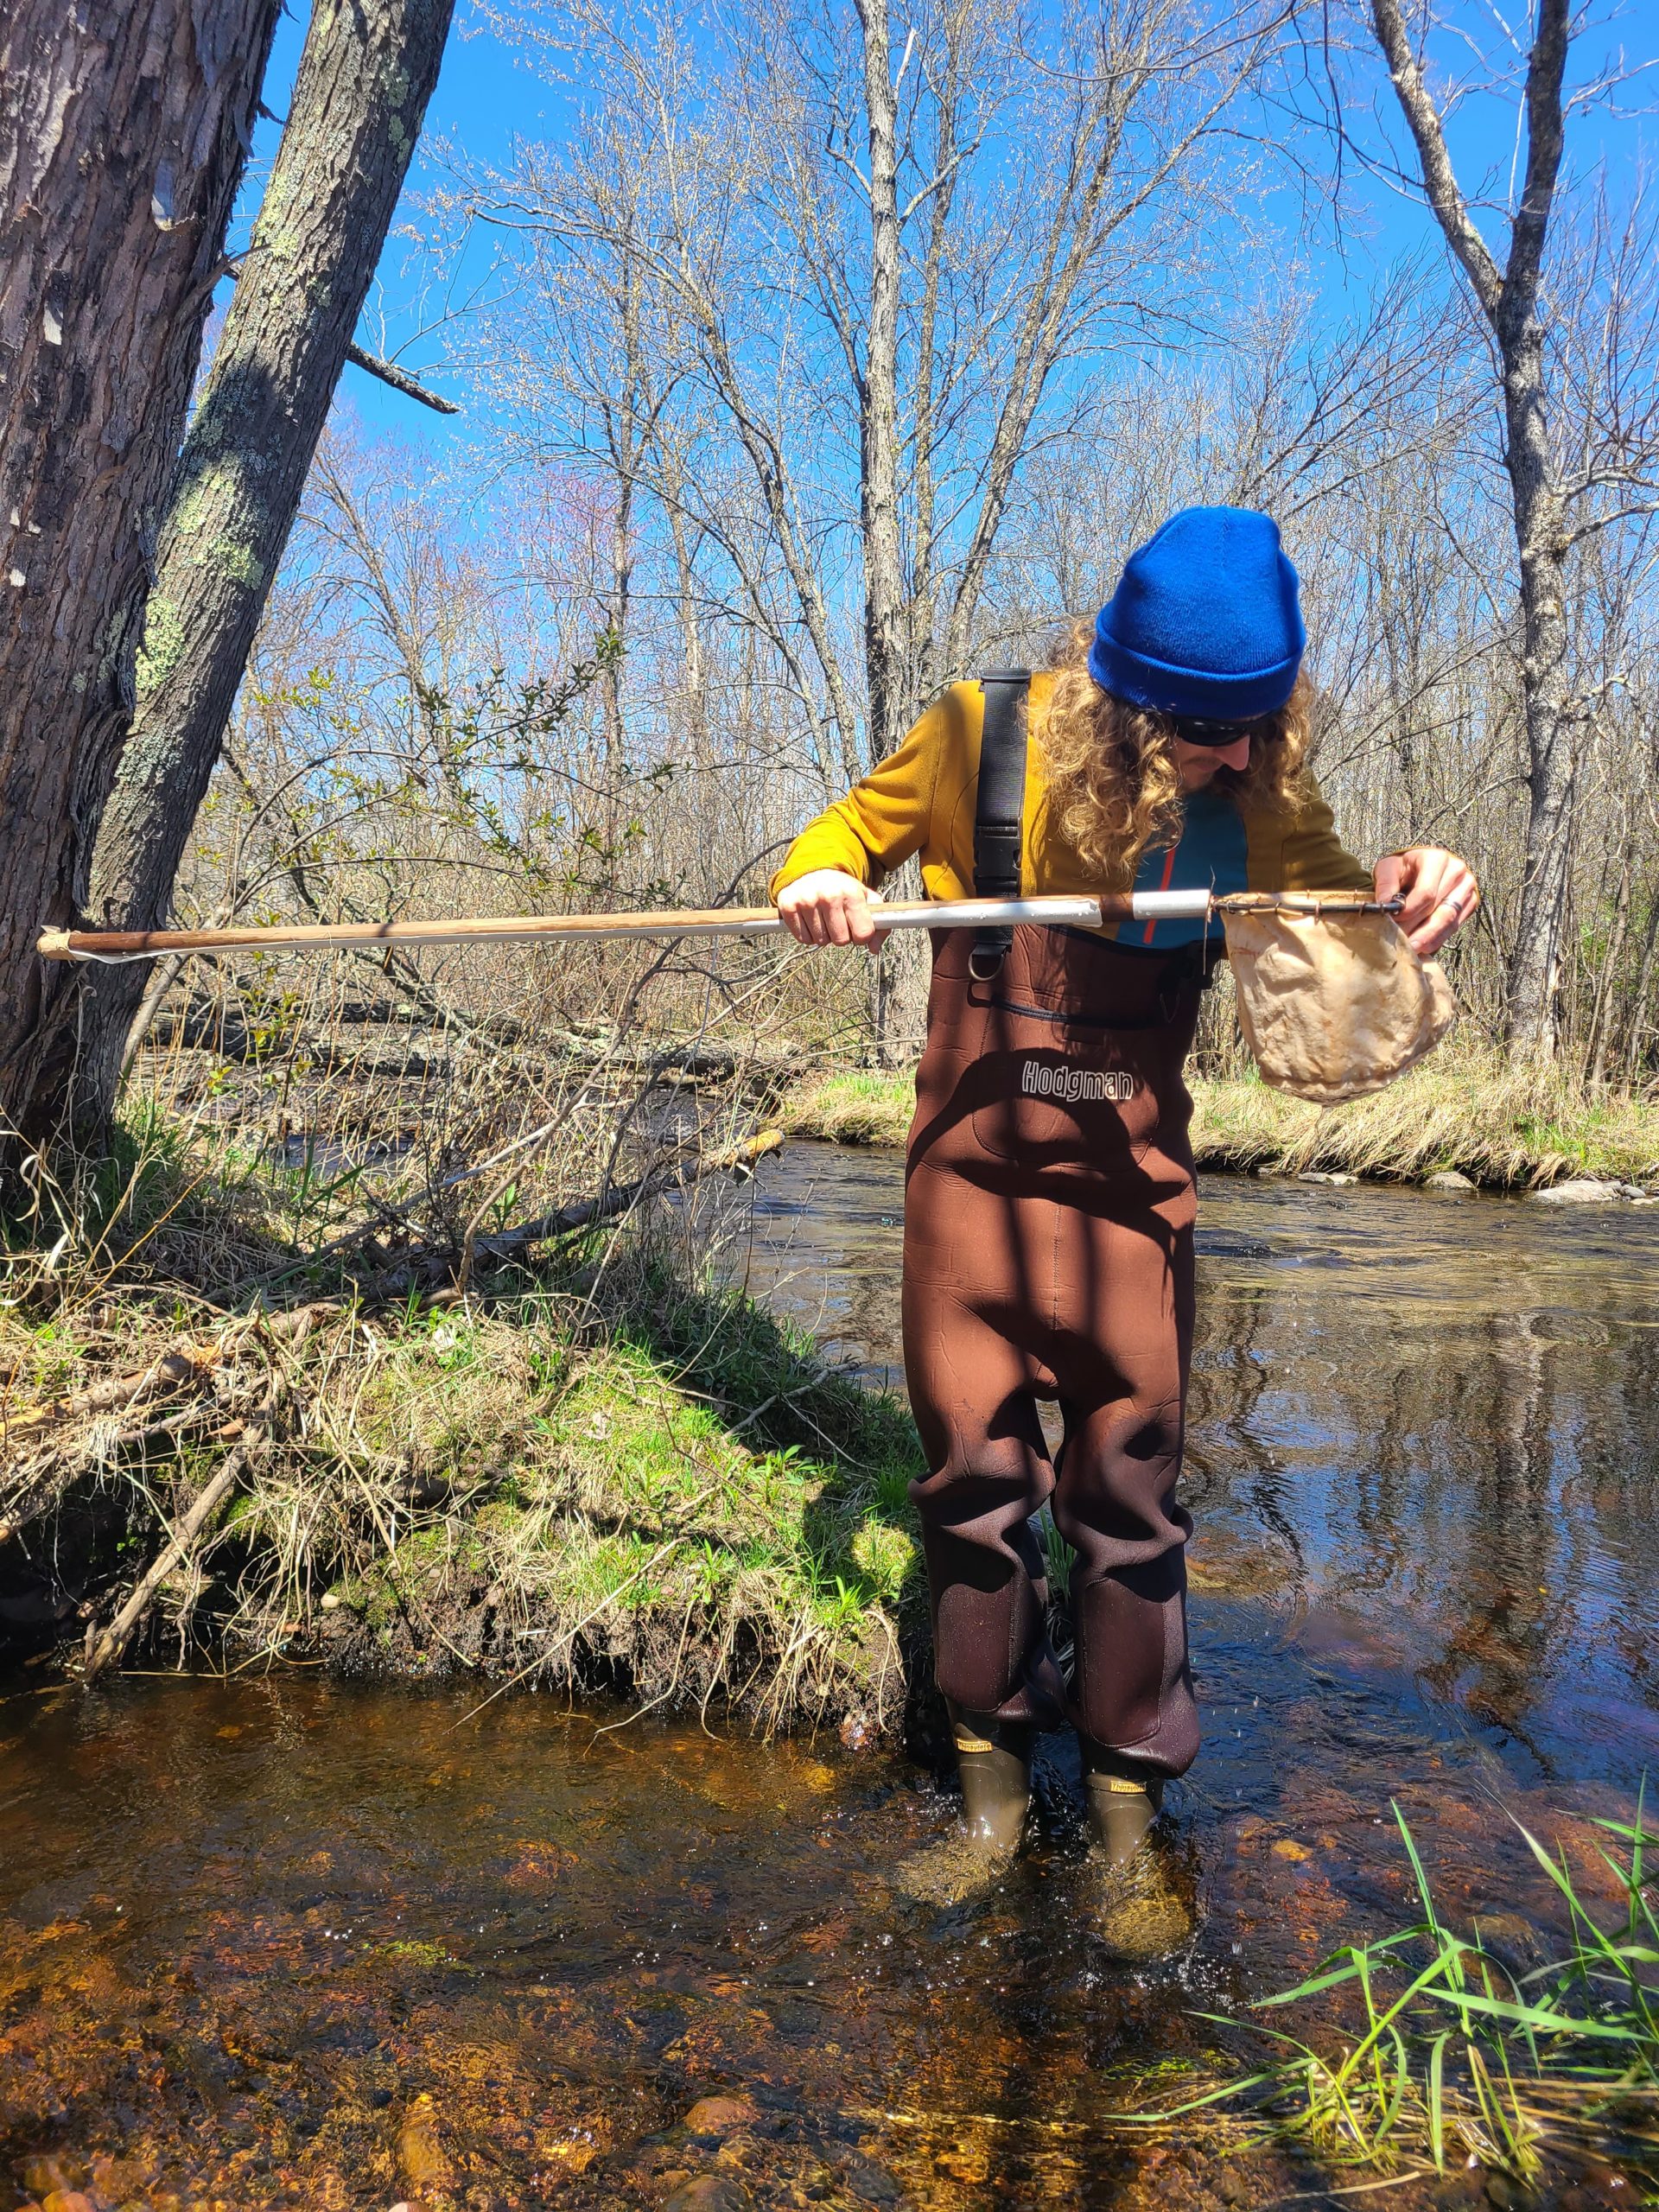
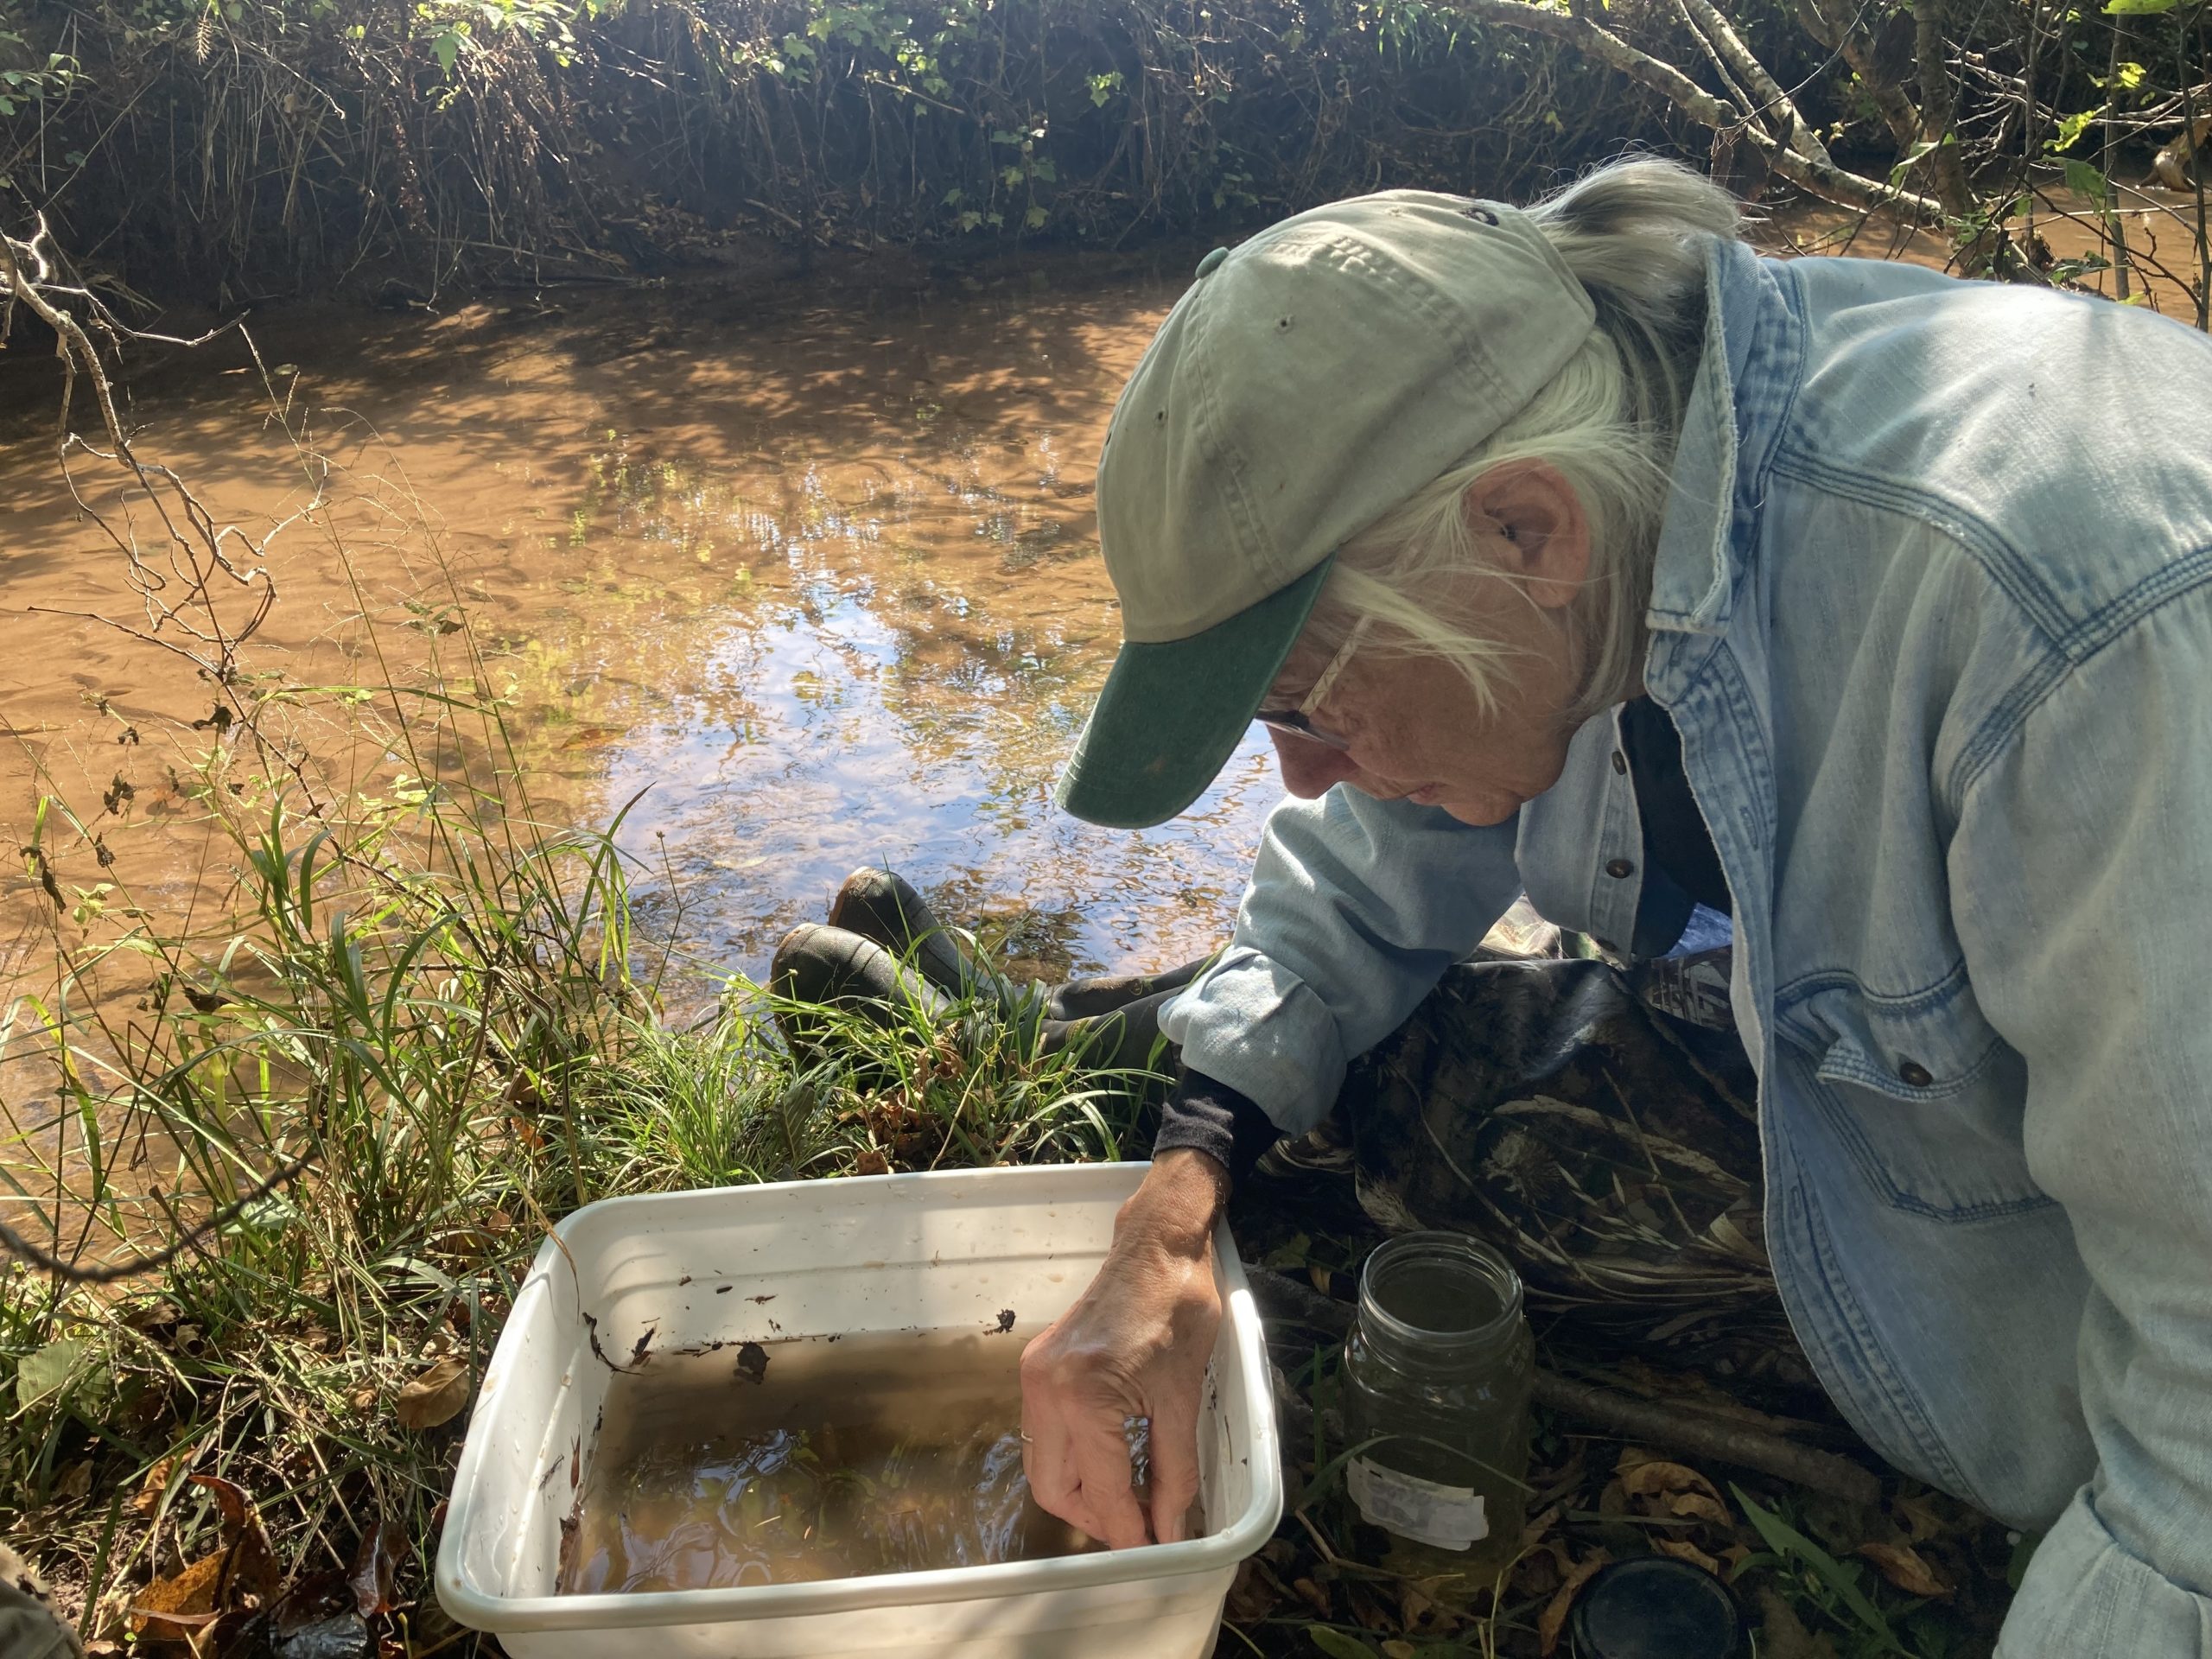
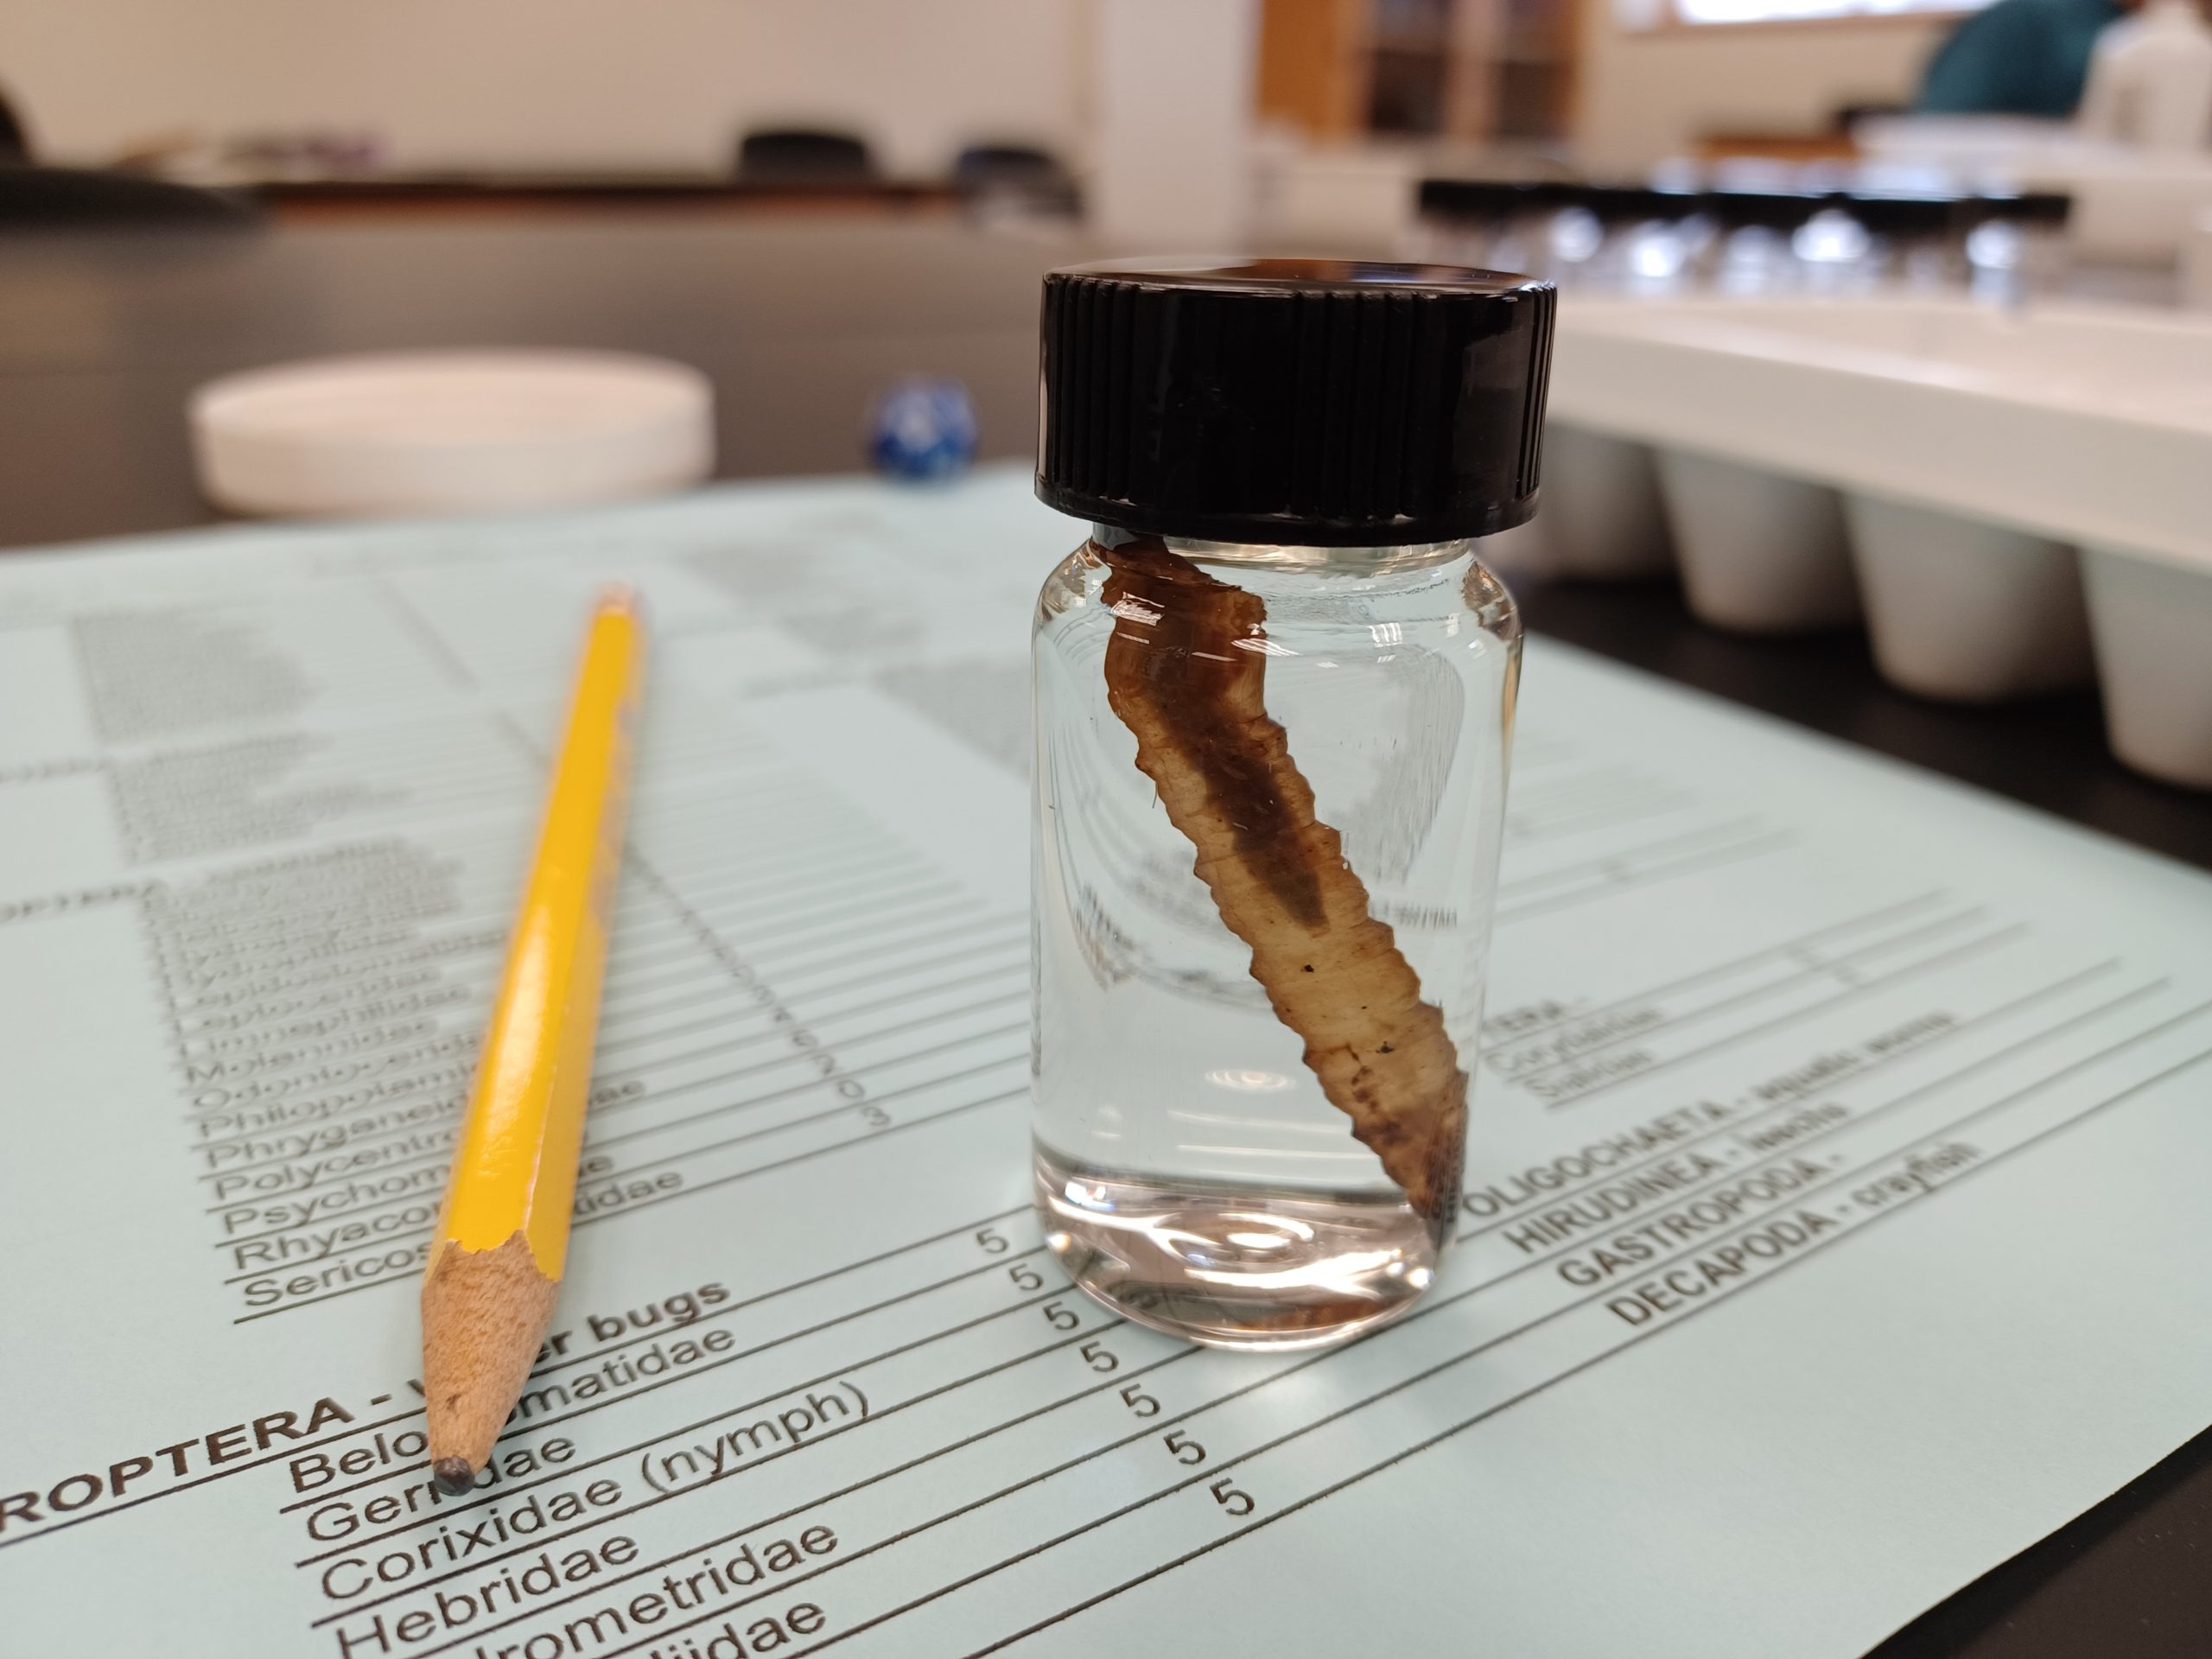
Every spring and fall, volunteers visit their sites and sample macroinvertebrates, or small organisms that spend most or all their lives living on the stream bottoms. Many are larvae for insects you might know, such as dragonflies. After collecting samples, the volunteers identify each type of macroinvertebrate.

Each species has a different tolerance for stress, such as pollution, changes in temperature, low oxygen, or flooding. So, along with their biological data SRWA also collects data such as temperature, the amount of oxygen available in the water, and turbidity, or the amount of sediment in the water. Some species are indicators of good water quality because they need very clear, cold water, with a lot of oxygen, while others can survive in dirtier or harsher conditions. By seeing which macroinvertebrates live in each stream, scientists can learn about the health of the water.

A macro invertebrate preserved for identification in the lab.

Two scientists, Will and Emma, are now analyzing over 20 years of volunteer data to identify trends and patterns. They want to see whether the water quality variables of temperature, dissolved oxygen, and turbidity affect the types of macroinvertebrates that can live in the tributaries. If there are a lot of sensitive indicator species in the sample, that is a good sign because it means the water quality is high. If they only find tolerant species, the water quality is likely poor, because indicator species were unable to survive in the environmental conditions at that site.

To do so, they use a tool called the Hilsenhoff Biotic Index. This index looks at which macroinvertebrates are present and how tolerant they are to pollution. HBI uses the living organisms that live at a site to provide an assessment of stream health over time, unlike chemical water tests which provide a snapshot of conditions at the time of testing. The index assigns a number from 1 to 10 based on the number and type of species in the sample. Lower numbers mean excellent water quality, and higher numbers mean poor water quality. 

Featured Scientists: Emma Holtan and Will Kendall with community volunteers from Superior Rivers Watershed Association. Written with: Andrea Pokrzywinski from Ashland High School.

Flesch–Kincaid Reading Grade Level = 10.8

Additional Teacher Resources:

Changing climates in the Rocky Mountains

Lower elevation site in the Rocky Mountains: Temperate conifer forest. Photo Credit: Alice Stears.

The activities are as follows:

Each type of plant needs specific conditions to grow and thrive. If conditions change, such as temperature or the amount of precipitation, plant communities may change as well. For example, as the climate warms, plant species might start to shift to higher latitudes to follow the conditions where they grow best. But what if a species does well in cold climates found at the tops of mountains? Because they have nowhere to go, warming puts that plant species at risk.  

To figure out if species are moving, we need to know where they’ve lived in the past, and if climates are changing. One way that we can study both things is to use the Global Vegetation Project. The goal of this project is to curate a global database of plant photos that can be used by educators and students around the world. Any individual can upload photos and identify plant species. The project then connects each photo to information on the location’s biome, ecoregion, and climate, including data tracking precipitation and temperature over time. The platform can also be used to explore how the climates of different regions are changing and use that information to predict how plant communities may change. 

Daniel is a scientist who is interested in sharing the Global Vegetation Project data with students. Daniel became interested in plants and vegetation when he learned in college that you can simply walk through the woods and prairie, collect wild seeds, germinate the plants, and grow them to restore degraded landscapes. Plants set the backdrop for virtually every landscape that we see. He thinks plants deserve our undivided attention.

Daniel and his team wanted to create a resource where students can look deeper into plant communities and their climates. Much of the inspiration for the Global Vegetation Project came from the limitations to undergraduate field research during the COVID-19 pandemic. Students in ecology and botany classes, who would normally observe and study plants in the field, were prevented from having these opportunities. By building an online database with photos of plants, students can explore local plants without having to go into the field and can even see plants from faraway places. 

Daniel’s lab is based in the Rocky Mountains in Wyoming, where the plants are a showcase in both biodiversity and beauty. These communities deal with harsh conditions: cold, windy and snowy winters, hot and dry summers, and unpredictable weather during spring and fall. The plants rely on winter snow slowly melting over spring and into summer, providing moisture that can help them survive the dry summers. 

The Rocky Mountains are currently facing many changes due to climate change, including drought, increased summer temperatures, wildfires, and more. This creates additional challenges for the plants of the Rockies. Drought reduces the amount of precipitation, decreasing the amount of water available to plants. In addition, warmer temperatures in winter and spring shift more precipitation to rain instead of snow and melts snow more quickly. Rain and melted snow rapidly move through the landscape, becoming less available to plants in need. On top of all this, hotter, drier summers further decrease the amount of water available, stressing plants in an already harsh environment. If these trends continue, there could be significant impact on the types of plants that are able to grow in the Rocky Mountains. These changes will have an impact on the landscape, organisms that rely on plants, and humans as well.

Daniel and his colleagues pulled climate data from a Historic period (1961-2009) and Current period (2010-2018). They selected two locations in Wyoming to focus on: a lower elevation montane forest and a higher elevation site. To study climate, they focused on temperature and precipitation because they are important for plants. They wanted to study how temperature and precipitation patterns changed overall and how they changed in different seasons. They predicated temperatures would be higher in the Current period compared to the Historic period in both locations. For precipitation, they predicted there would be drier summers and wetter springs.

Featured scientist: Daniel Laughlin from The University of Wyoming. Written by: Matt Bisk.

Flesch–Kincaid Reading Grade Level = 10.5

Additional teacher resource related to this Data Nugget:

Fishy origins

Fred Bogue holding a striped bass.

The activities are as follows:

Striped bass, or stripers, make up one of the most important fisheries for seafood and sport fishing on the East Coast of the United States. Carleigh and Chelsea, biology teachers in New Jersey, were at the beach one day when they saw a couple of stripers in the Barnegat Bay Inlet. Both teachers have always been interested in research and even met while participating in a summer research program as undergraduate students. Since then, both have gone on to complete more research projects in biology and education. Their curiosity about striper populations led them to work together yet again! 

They headed to Monmouth University in New Jersey, where they began working with two scientists, Megan and John. They learned that locations where fish reproduce are called spawning grounds. Young stripers spend 2-3 years developing in the spawning ground before moving downstream. When stripers become adults, they return to the same location to breed. 

There are four main spawning grounds for stripers on the East coast: the Hudson River, the Chesapeake Bay, Delaware River, and the Albermarle Sound. Stripers from these areas are considered to be different stocks. Stripers are migratory fish, and generally move north in the spring and south in the fall. Because they all migrate to New Jersey, fish from different stocks combine, which results in a mixed stock. When there is a population that has a mixed stock, we don’t know which spawning ground the fish originally came from. Conservation and management of New Jersey’s striper fishery requires knowing where the fish come from. Understanding which spawning grounds stripers are using helps managers make sure we are not overfishing or damaging these important environments. So, Carleigh and Chelsea joined a project that is working to find out how we can identify where mixed stock stripers come from. 

For their study, the scientists caught stripers in three different locations off the New Jersey coast in 2017. The fish were sampled by clipping off a small portion of the right pelvic fin. The scientists then extracted the DNA from each sample in the lab. They used polymerase chain reaction (PCR) to then copy regions of the DNA, called microsatellites. Microsatellites are small, repeating sections of DNA that can be variable enough to distinguish even close relatives. These data were then used to compare DNA samples from the unknown mixed stocks to the known spawning ground stocks. The scientists also recorded whether each fish was young or mature. The scientists then used the age data to tell whether the spawning grounds might be changing over time. 

Featured scientists: Carleigh Engstrom, Chelsea Barreto, Megan Phifer-Rixey, and John Tiedemann from Monmouth University 

Flesch–Kincaid Reading Grade Level = 9.2