Gone fishin’ for survival

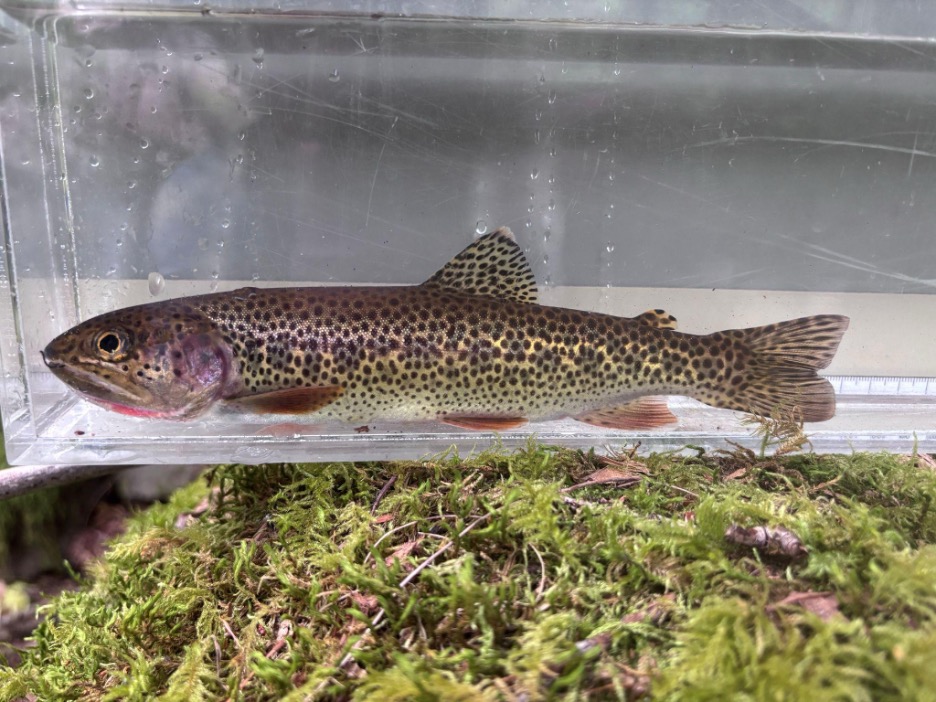
A coastal cutthroat trout in a holding tank.

The activities are as follows:

Climate change is affecting our world in many ways. Globally, we are experiencing more droughts and wildfires, shifting seasons, and rising sea levels. Species are responding as well. Some can shift their ranges to follow cooler temperatures. But what about organisms, like fish, that cannot easily move to a new location?

A group of scientists is studying fish in streams in central Oregon to learn more. The H.J. Andrews Experimental Forest, also called the Andrews, is a long-term research site in the Cascade Mountains of central Oregon. Scientists have been collecting data there for decades! The Andrews is an old-growth temperate rainforest with a dense canopy of trees. These trees block the sun’s heat, keeping the understory and streams below cool.
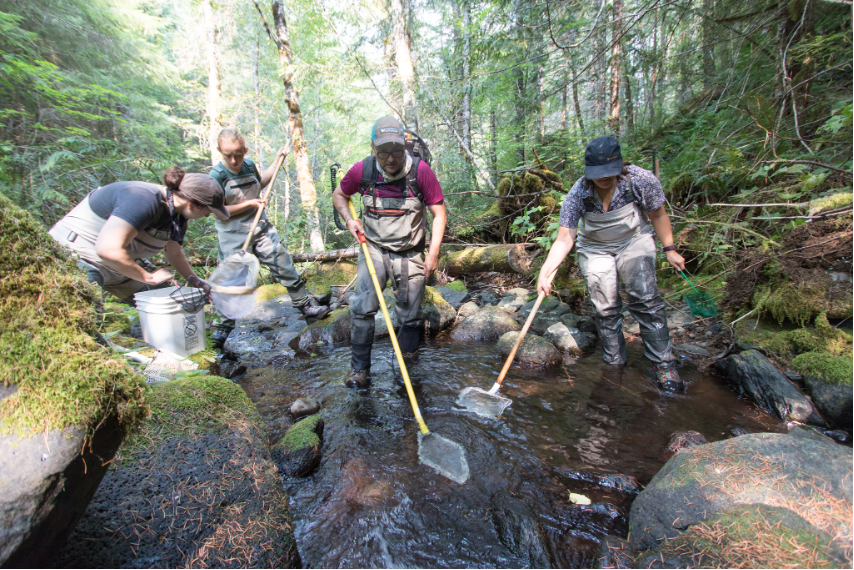
Ivan and his team electrofishing Mack Creek to sample the trout population.

Ivan is a biologist on this team who studies fish in these streams. Originally from southern Chile, he has spent decades studying ecology in both marine and freshwater environments. Ivan first came to Oregon to study how logging affects stream ecosystems. While working at the Andrews, he noticed that air temperatures in the forest were getting warmer over time. He wondered if the stream temperatures were warming too and whether this change might be affecting the fish that live there. He focused on coastal cutthroat trout living in Mack Creek, a stream within the Andrews.

Ivan started his exploration with data from historical surveys. For many years, scientists, staff, and students at the Andrews have been sampling coastal cutthroat trout in the streams. They collect data on their body size and other health measures. Ivan and his team found data on trout fork lengths, or the distance in millimeters (mm) from the tip of the fish’s snout to the center of its tail, dating back to the 1980s. Ivan used these data to calculate the median fork length of trout measured each year. The median is the middle value when all the trout are ordered from smallest to largest.
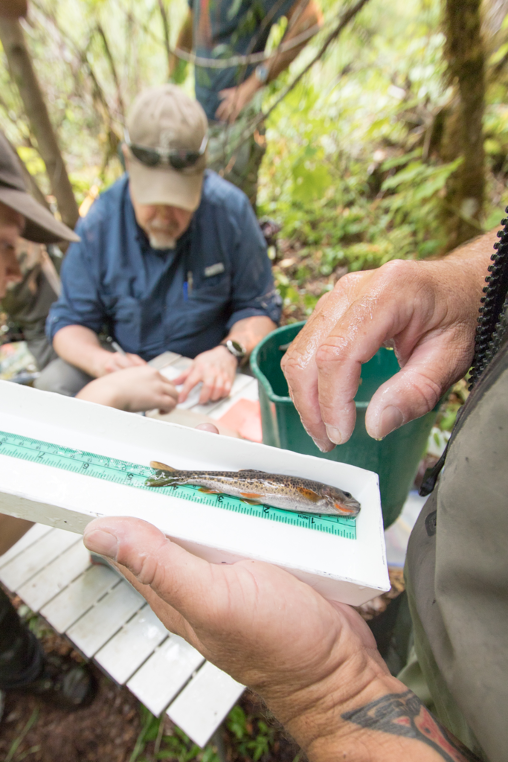
Each trout is measured before being released back into the creek.

Ivan also found data on Mack Creek water temperature for the same years as the fish length data. Ivan focused on summer water temperatures because these would be the warmest experienced by the trout each year. He found the highest water temperature recorded each summer day, called daily maximum temperature. He then averaged all the daily maximums for each summer, which gave him one temperature value for each year. This value is the average maximum summer water temperature.

Ivan predicted that he would see stream temperatures go up over time due to climate change impacting the Andrews. He also predicted that trout median fork lengths would be getting shorter over time. He based this idea on the temperature-size rule, a common pattern seen in fish. In warmer temperatures, fish metabolism speeds up, and animals with faster metabolisms often mature at a smaller body size. This would support the idea that climate change was leading to smaller fish in the Andrews.

Featured scientist: Ivan Arismendi from Oregon State University, H.J. Andrews Experimental Forest Long Term Ecological Research Site.

Written by Ryan Herlands (he/him) from Springfield Public Schools and Matthew Retterath (he/him) from Fridley Public Schools

Flesch–Kincaid Reading Grade Level = 9.2

Additional Teacher Resources:

You can learn more about the H.J. Andrews experimental forest here. This site is part of the long-term ecological research (LTER) network.

Lake Superior Rhythms

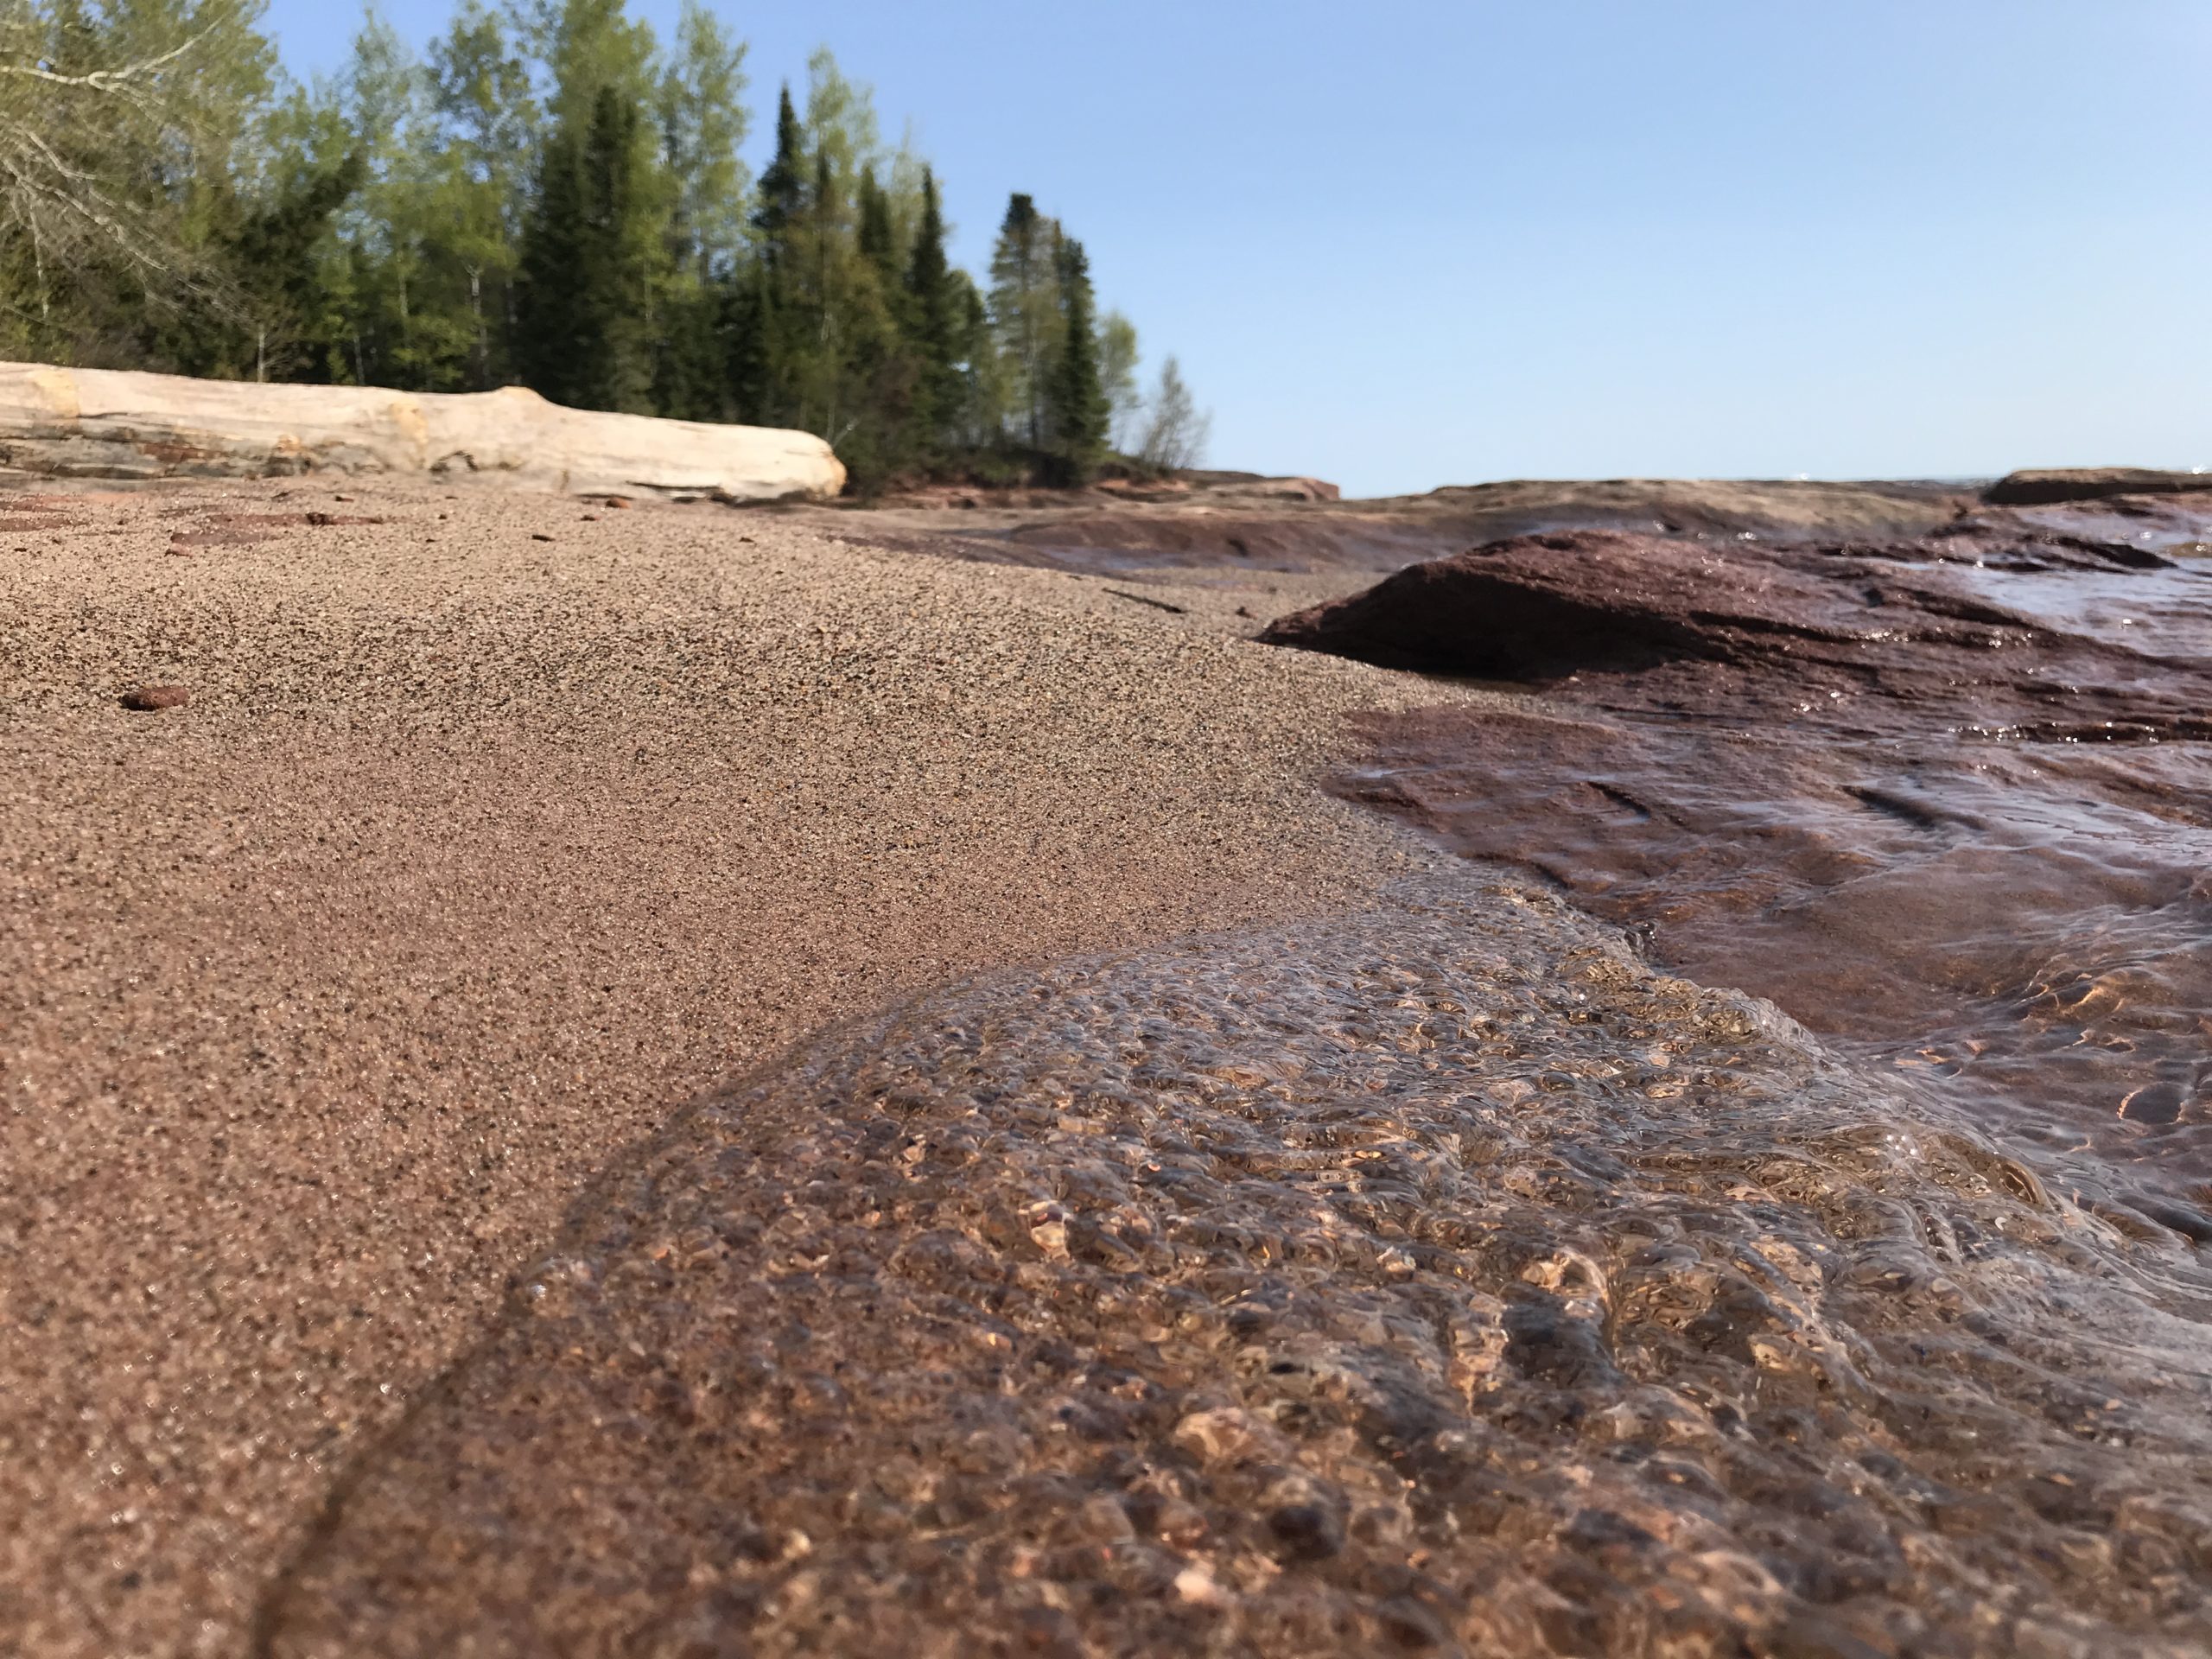
A sandy Lake Superior shoreline near Bayfield, WI.

The activities are as follows:

Gena and Ali are sisters who grew up in Bayfield, Wisconsin on the south shore of Lake Superior. When they were young, they spent many summer days sailing in the Apostle Islands National Lakeshore with their parents and friends. As they relaxed on the beach, they would watch how the lake changed. Even over a short period of time, they would see the landscape change. In just a few hours, a rock that was visible above the water’s surface when they arrived would slowly become submerged, only to reappear several hours later.

In high school, Gena and Ali set out to learn about the geophysical forces acting on Lake Superior. They wanted to investigate why they would sometimes see such dramatic fluctuations in water levels. They also wanted to know why water from rivers and streams would sometimes flow out into the lake, while other times it would flow back into the tributaries.

Ali presents research results on how the seiche changes the local water levels.

They learned that large lakes exhibit a phenomenon called a seiche (pronounced saysh). Like tides, a seiche is a periodic rising and falling of water levels. However, tides and seiches are caused by two different forces. Whereas tides are connected to the sun and moon, seiches are caused by changes in atmospheric pressure and strong winds.

Many atmospheric events can exert force on the water, including storms that come and go, heavy rain, cold fronts blowing through, or the calming of strong winds. You can think of Lake Superior as a giant bathtub, and the seiche is the water sloshing back and forth as it is pushed by a force and then released.

Gena and Ali realized that the seiche probably explained the water level changes they saw on Lake Superior. They became curious to learn more about the lake’s seiche pattern. An atmospheric event can cause the water to slosh from one side of the lake to the other several times. They predicted the seiche would look like a wave pattern as the water comes and goes.

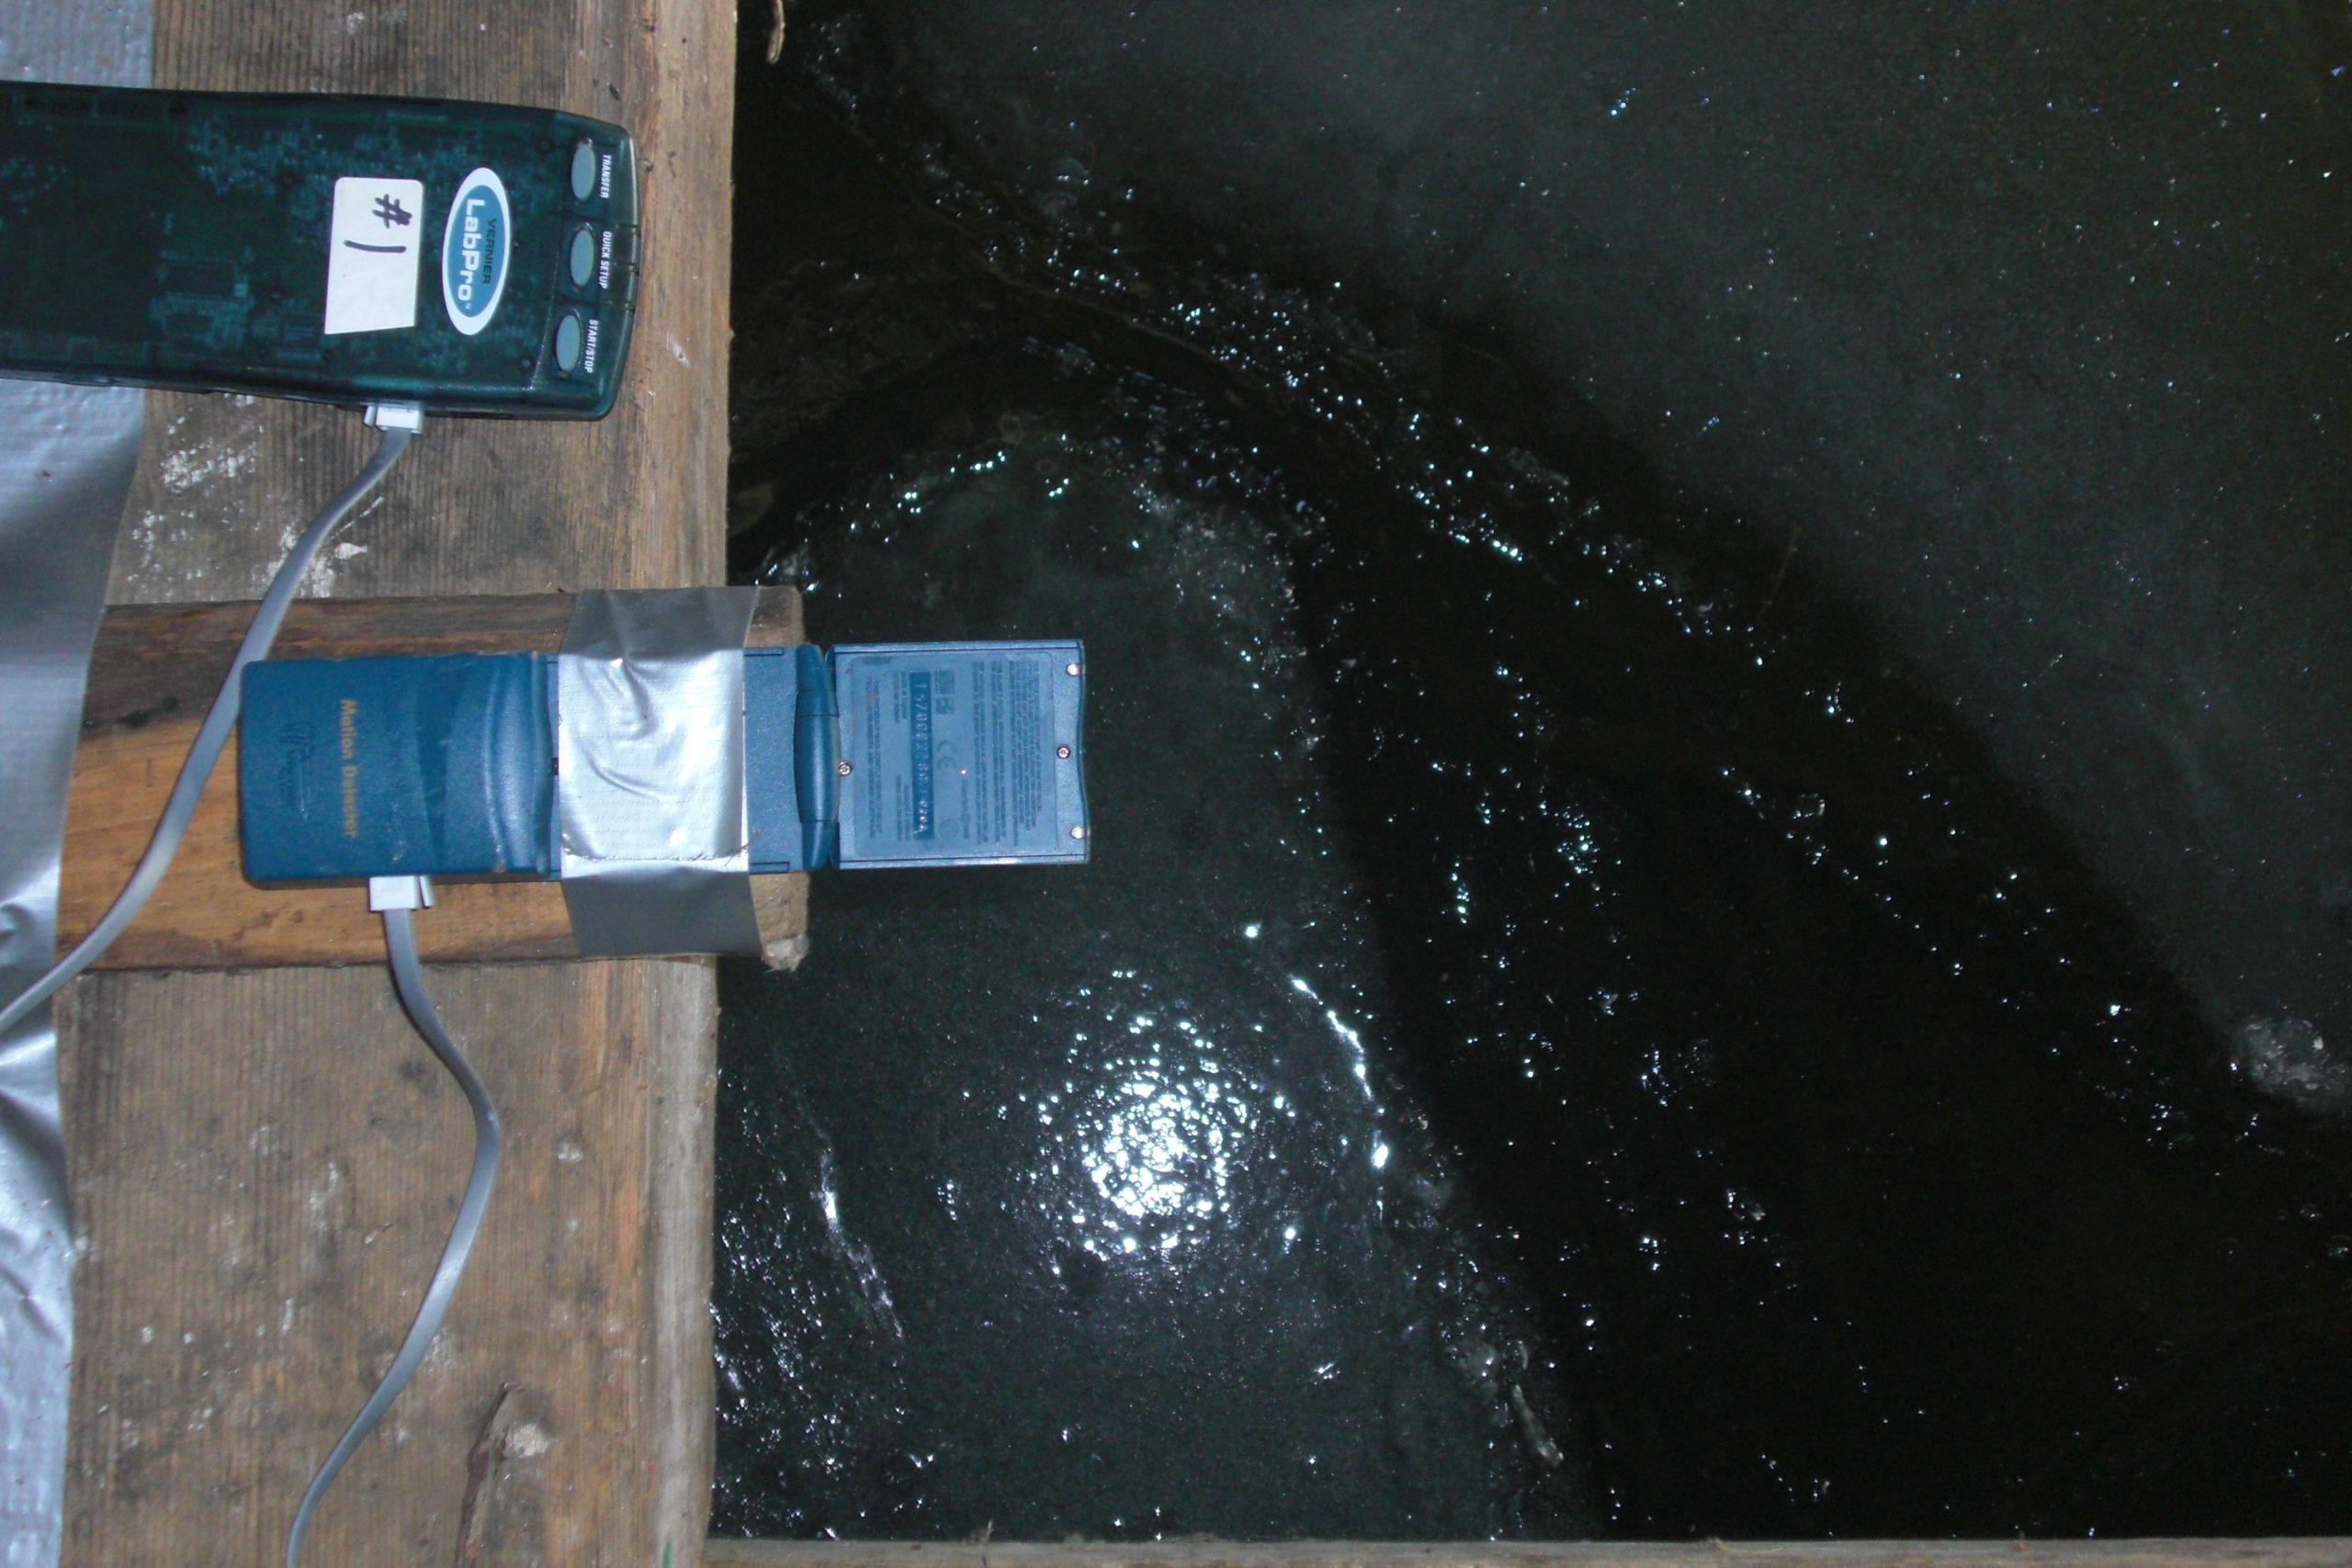
The sensor with data recorder on the dock inside a boathouse.

To test their ideas, they decided to investigate how often the water switched directions and how much the water level changed because of the seiche. In other words, they wanted to measure the amplitude and period of the seiche. The amplitude is the height of a wave from its midpoint, or equilibrium. The amplitude can be calculated as half of the water level change from its highest and lowest point in a cycle. The length of time it takes to complete one full back-and-forth cycle is called the period. You can track the period of the seiche by how much time has passed from one peak to the next peak.

Over their summer break, Gena and Ali started to plan how they could document changes in water levels in their hometown. With permission, Gena and Ali placed a sensor inside a boathouse that was protected from wave action. The sensor measured the distance to the nearest object and was set to collect a data point every six minutes. Gena and Ali placed the sensor so that it faced the surface of the water. That way, it would document changes in the water level throughout time.

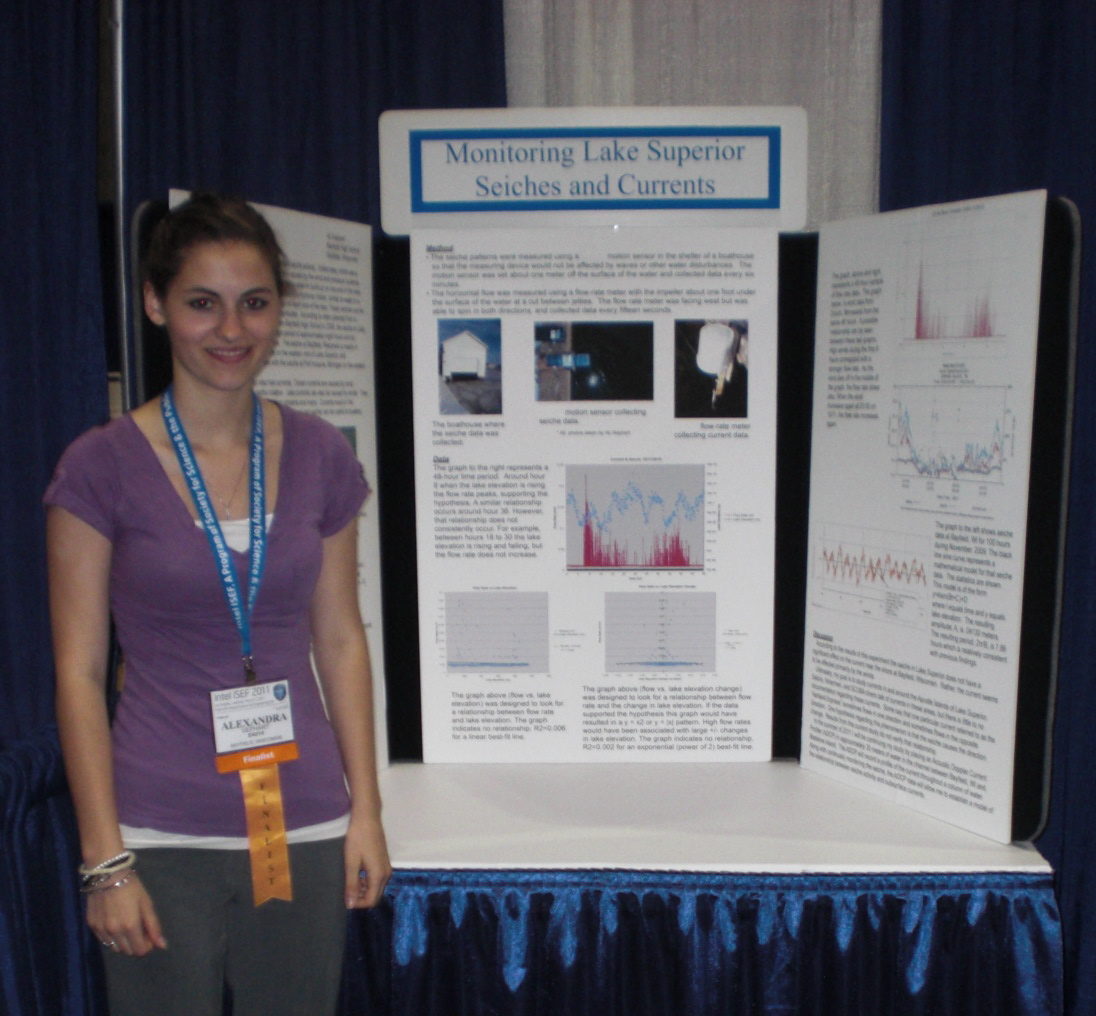
Featured scientists: Gena (she/her) and Ali Gephart (she/her), Bayfield High School.

Written by: Richard Erickson, Bayfield High School, and Hannah Erickson, Boston Public Schools.

Flesch–Kincaid Reading Grade Level = 8.8

Additional teacher resources related to this Data Nugget include:

  • Here is a link to learn more about the physics of waves.
  • Visit this NOAA website to learn more about seiche behavior and characteristics.