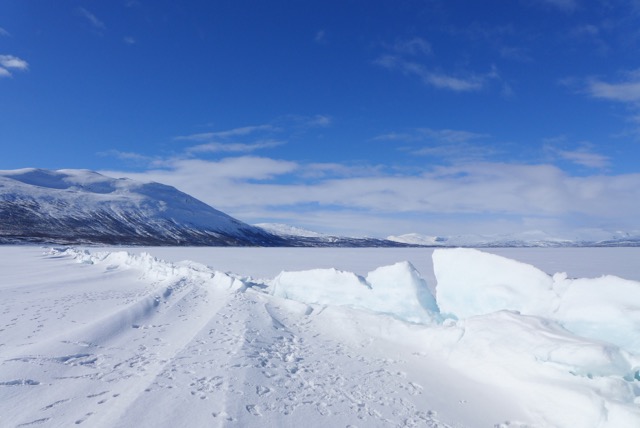
A view of sea ice in the Artic Ocean.
The activities are as follows:
- Teacher Guide
- Student activity, Level 4
- Grading Rubric
- An adapted version of the original scientific paper
Think of the North Pole as one big ice cube – a vast sheet of ice, only a few meters thick, floating over the Arctic Ocean. Historically, the amount of Arctic sea ice would be at a maximum in March. The cold temperatures over the long winter cause the ocean water to freeze and ice to accumulate. By September, the warm summer temperatures cause about 60% of the sea ice to melt every year. With global warming, more sea ice is melting than ever before. If more ice melts in the summer than is formed in the winter, the Arctic Ocean will become ice-free, and would change the Earth as we know it.
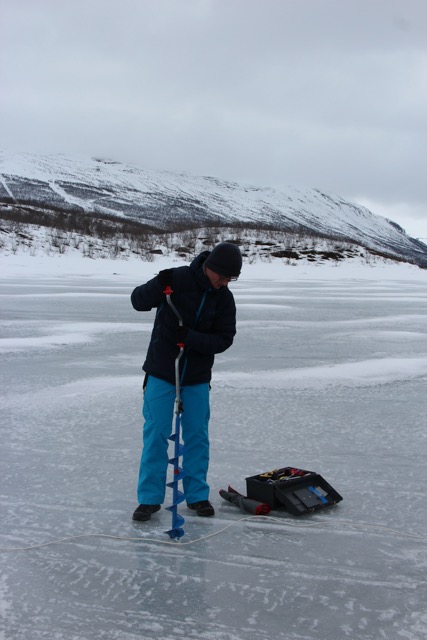
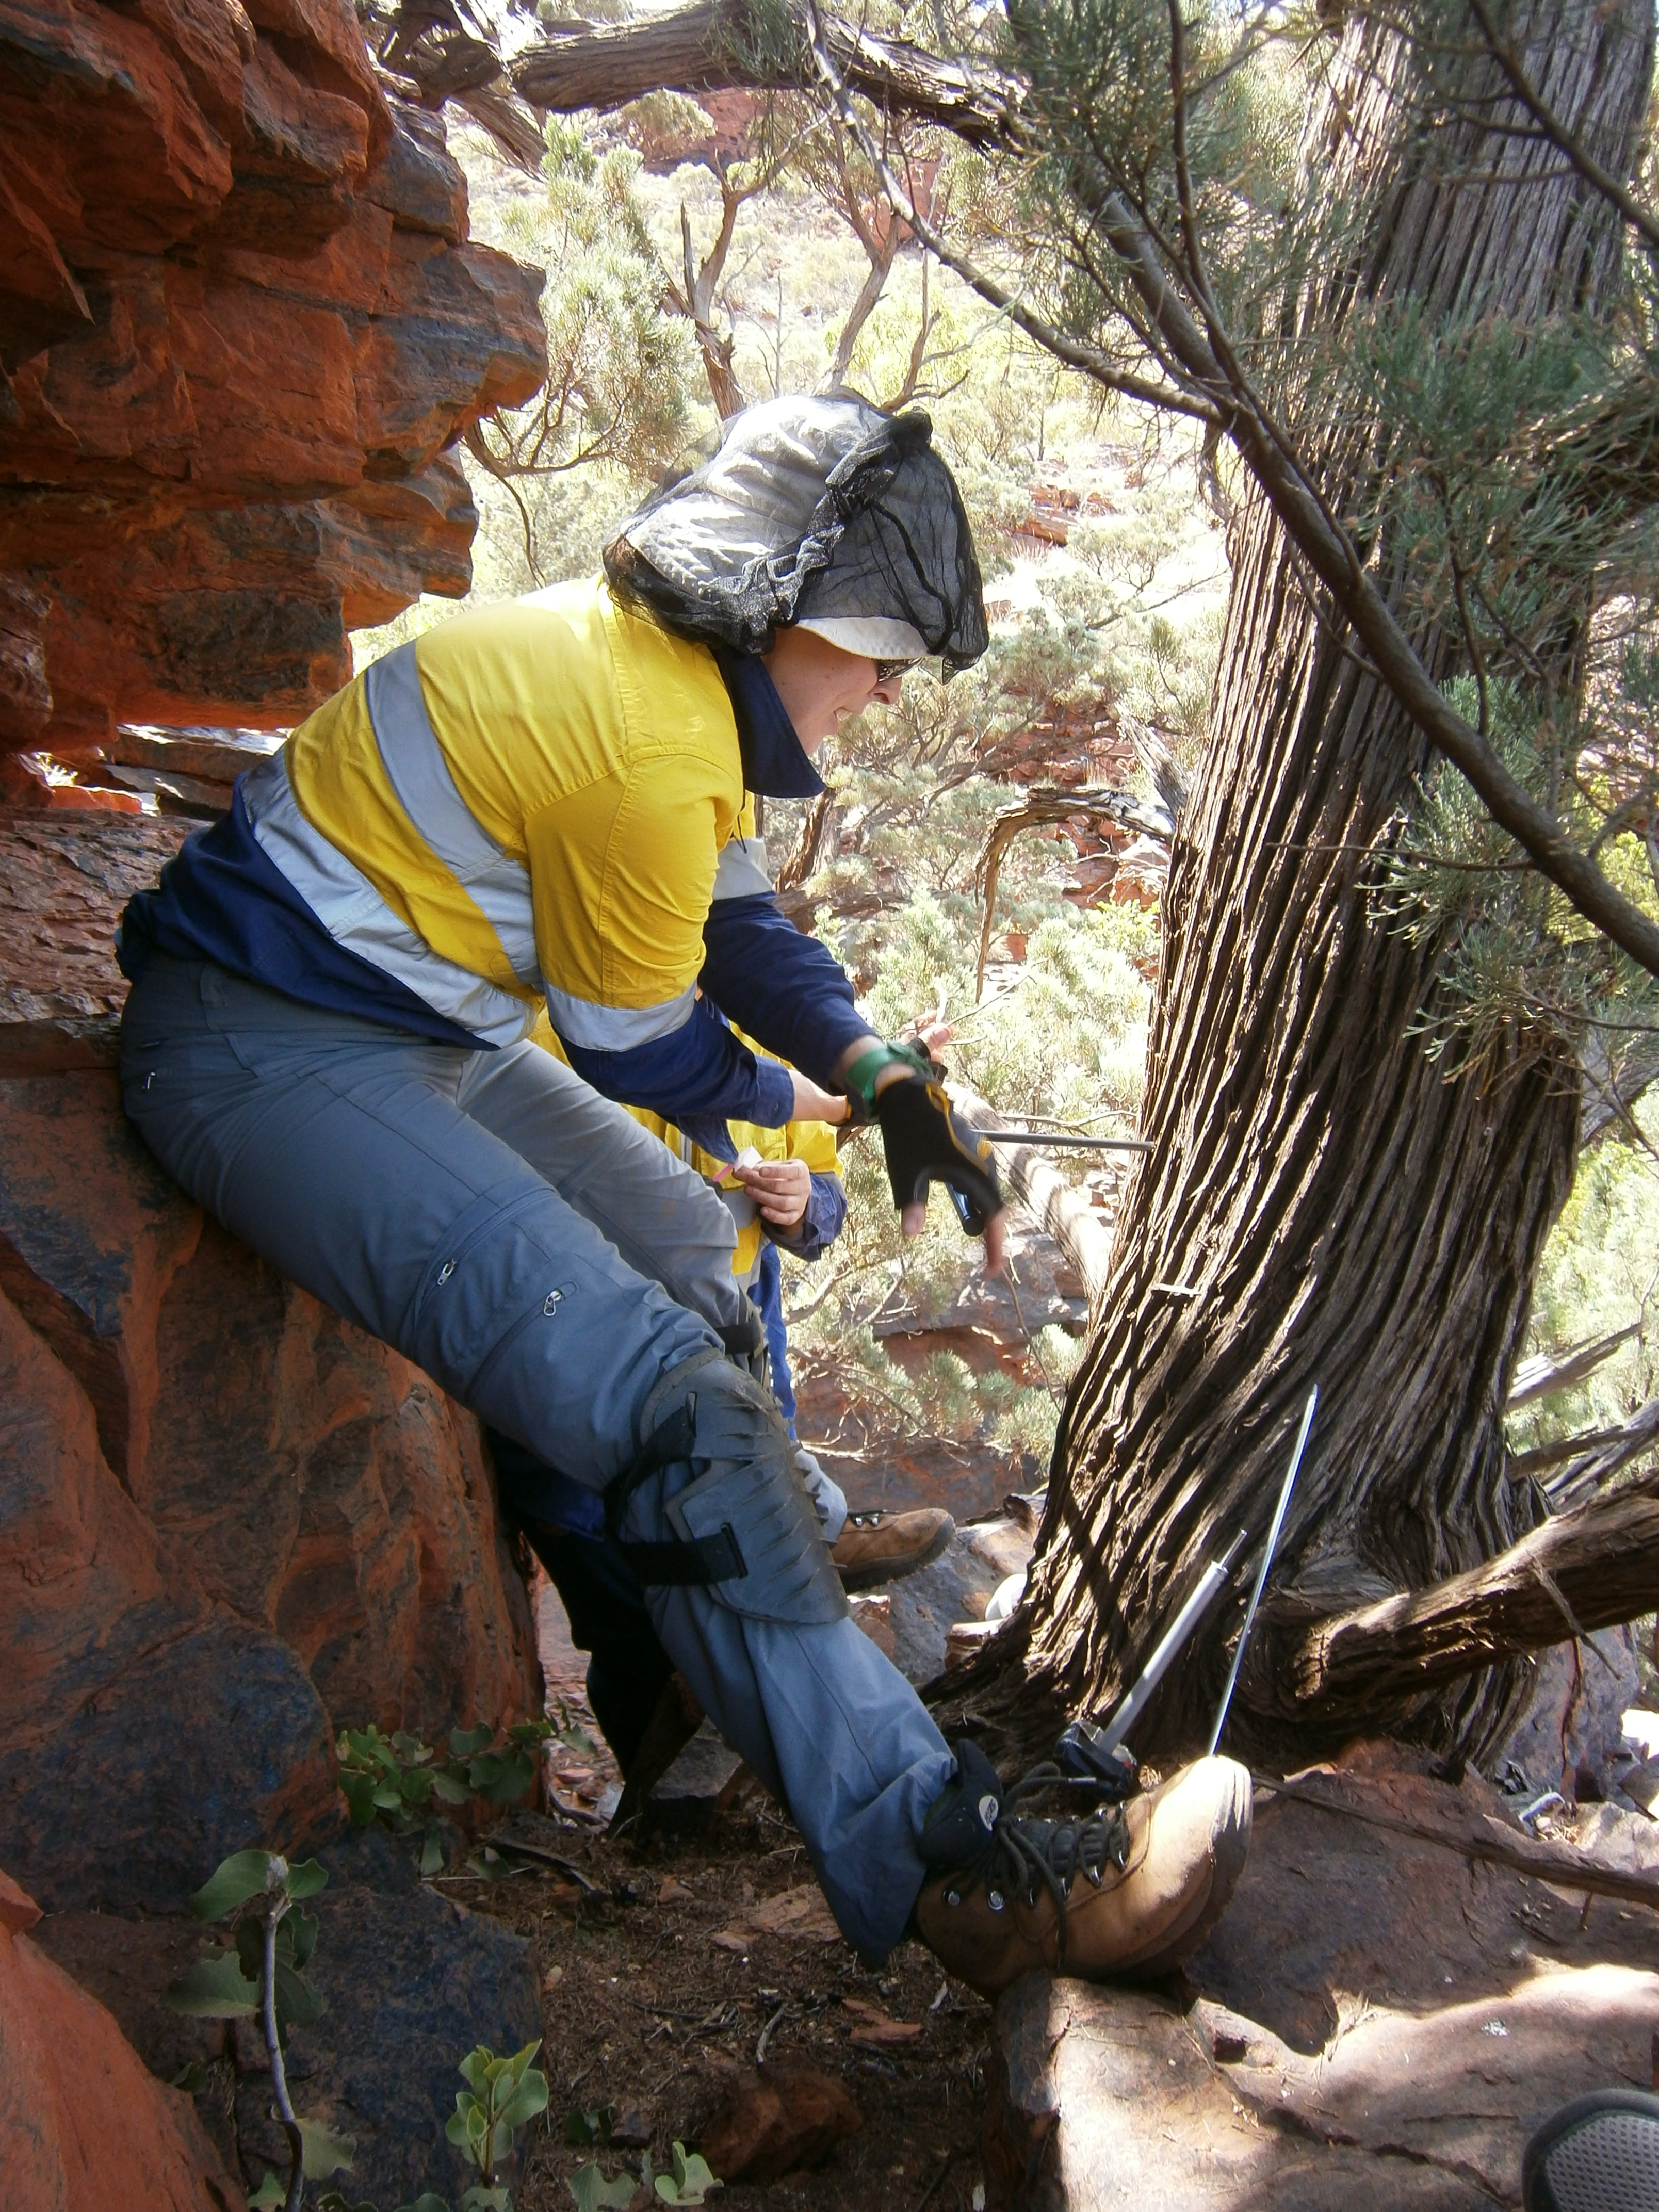
Student drills through lake ice
This loss of sea ice can have huge impacts on Arctic species and can also affect climate around the globe. For example, polar bears stand on the sea ice when they hunt. Without this platform they can’t catch their prey, leading to increased starvation. Beyond the Arctic, loss of sea ice can increase global climate change through the albedo effect (or the amount of incoming solar radiation that is reflected by a surface). Because ice is so white, it has high albedo and reflects a lot of the sunlight that hits it and keeps the earth cooler. Ice’s high albedo is why it seems so bright when the sun reflects off snow. When the ice melts and is replaced by water, which has a much lower albedo, more sunlight is absorbed by the earth’s surface and temperatures go up.
Scientists wanted to know whether the loss of sea ice and decreased albedo could affect extreme weather in the northern hemisphere. Extreme weather events are short-term atmospheric conditions that have been historically uncommon, like a very cold winter or a summer with a lot of rain. Extreme weather has important impacts on humans and nature. For example, for humans, extreme cold requires greater energy use to heat our homes and clear our roads, often increasing the use of fossil fuels. For wildlife, extreme cold could require changes in behavior, like finding more food, building better shelter, or a moving to a warmer location.
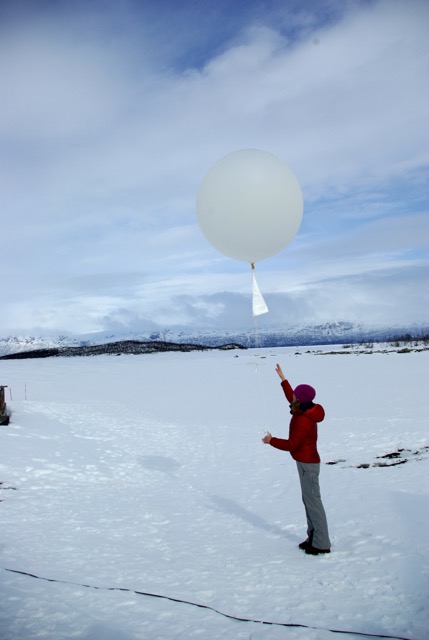
Student releases weather balloon
To make predictions about how the climate might change in the coming decades to centuries, scientists use climate models. Models are representations, often simplifications, of a structure or system used to make predictions. Climate models are incredibly complex. For example, climate models must describe, through mathematical equations, how water that evaporates in one region is transferred through the atmosphere to another region, potentially hundreds of miles away, and falls to the ground as precipitation.
James is a climate scientist who, along with his colleagues, wondered how the loss of arctic sea ice would affect climates around the globe. He used two well-established climate models – (1) the UK’s Hadley Centre model and (2) the US’s National Center for Atmospheric Research model. These models have been used previously by the Intergovernmental Panel on Climate Change (IPCC) to predict how much sea ice to expect in 2100.
Featured scientists: James Screen from University of Exeter, Clara Deser from National Center for Atmospheric Research, and Lantao Sun from University of Colorado at Boulder. Written by Erin Conlisk from Science Journal for Kids.
Flesch–Kincaid Reading Grade Level = 10.2
 This Data Nugget was adapted from a primary literature activity developed by Science Journal For Kids. For a more detailed version of this lesson plan, including a supplemental reading, videos, and extension activities, visit their website and register for free!
There is one scientific paper associated with the data in this Data Nugget. The citation and PDF of the paper is below.
- Screen J.A., Deser C., Sun L. 2015. Projected changes in regional climate extremes arising from Arctic sea ice loss. Environmental Research Letters 10: 084006.
- The same paper, written at a middle/high school reading level by Science Journal for Kids, can be found here.
You can play this video, showing changes in Arctic sea ice from 1987-2014, overhead at the start of class (no sound required). Each student should write down a couple of observations and questions.