Round goby, skinny goby

An invasive round goby from the Kalamazoo River, Michigan.

The activities are as follows:

Animals often have adaptations, or traits that help them live in certain environments. For fish, that can mean having a body shape that allows them to feed on available prey, better hide from predators, or swim more effortlessly. When these traits vary within the same species from one location to another, they are called local adaptations. Such adaptations were once thought to only evolve slowly over hundreds or thousands of generations. However, new evidence shows that evolution can result in meaningful adaptations much more quickly than originally thought, sometimes in just a few generations!

Invasive species are those that have been moved by humans to areas where they do not usually exist and cause disruptions to native ecosystems. Because they have been moved to new places where they did not evolve, invasive species often have traits that aren’t matched to their new habitats. When mismatches occur, species may be able to adapt in just a few generations in their new locations.

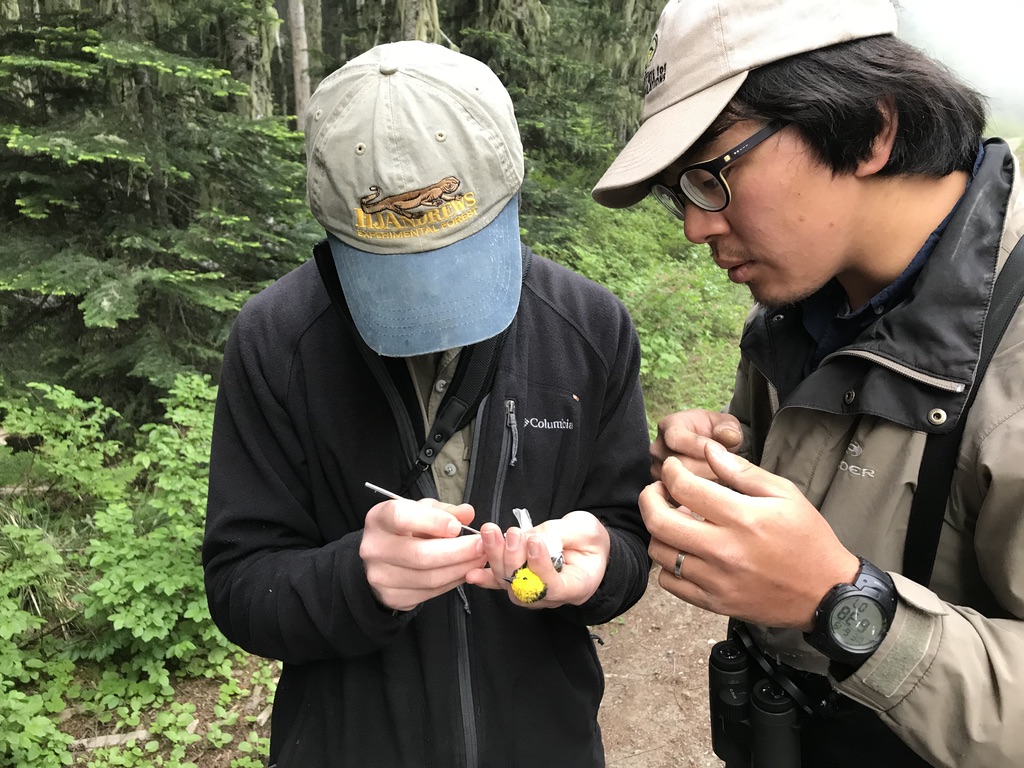
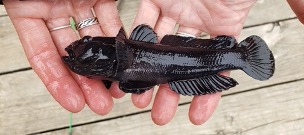
Several invasive species have been problematic in the Great Lakes of North America. The round goby is a small invasive fish species that arrived in the Great Lakes around 1990. It is a bottom-dwelling species that is able to quickly reproduce and crowd out native fish species. Both avid anglers, Jared and Bailey observed the increasing numbers of round gobies during their time spent outdoors. They noticed that sometimes round gobies would even outnumber all other native fish in an area.

Originally appearing just in the Great Lakes themselves, the species is increasingly being found in rivers throughout the region. Jared and Bailey were surprised this species did so well in both river and large lake habitats since they are very different environments for fish to live. For example, water is constantly flowing downstream in rivers, whereas lakes can be still or have waves near the shore. Also, these two habitats have different predator and prey species living in them and differ in water chemistry characteristics. With the spread of more and more round gobies into rivers, Jared and Bailey set out to learn how this species is successful in both habitats. They thought that round gobies found in rivers would have adaptations to help navigate fast flowing waters. Fish with narrower body shapes can move more easily in flowing waters, giving narrow-bodied individuals an advantage over those with bulkier bodies. Over time, those individuals with such an advantage would be more likely to survive and reproduce in the rivers, eventually shifting the entire river-dwelling population to a narrow body shape. They predicted that round gobies from rivers would have shorter body depths and narrower caudal peduncles, which is the area between the fish’s body and tail. To test their idea, Jared and Bailey captured and measured hundreds of round gobies from both Great Lakes and inland river habitats.

Michigan State University researcher Bailey Lorencen fishing for gobies in a Michigan river.

Featured scientists: Jared Homola (he/him) and Bailey Lorencen (she/her) from Michigan State University

Flesch–Kincaid Reading Grade Level = 11.2

Trees and bushes, home sweet home for warblers

Matt, Sarah, and Hankyu – a team of scientists at Andrews Forest, measuring bird populations.

The activities are as follows:

The birds at a beach are very different from those in the forest. This is because each bird species has their own set of needs that allows them to thrive where they live. Habitats must have the right collection of food to eat, places to shelter and raise young, safety from predators, and the right environmental conditions like temperature and moisture. 

The vast coniferous forests of the Pacific Northwest provide rich and diverse habitat types for birds. These forests are also a large source of timber, meaning they are economically valuable for people. Disturbances from logging and natural events result in a forest that has many different habitat types for birds to choose from. In general, areas of forest that have been harvested more recently will have more understory, such as shrubs and short trees. Old-growth forests usually have higher plant diversity and larger trees. They are also more likely to have downed trees or standing dead trees, which are important for some bird species. Other disturbances like wildfire, wind, large snow events, and forest disease also have large impacts on bird habitat.

At the Andrews Forest Long-Term Ecological Research site in the Cascade Mountains of Oregon, scientists have spent decades studying how the plants, animals, land use, and climate are all connected. In the past, Andrews Forest had experiments manipulating timber harvesting and forest re-growth. This land use history has large impacts on the habitats found in an area. Many teams of scientists work in this forest, each with their own area of research. Piece by piece, like assembling a puzzle, they combine their data to try to understand the whole ecosystem. 

Collecting data on a warbler.

Matt, Sarah, and Hankyu have been collecting long-term data on the number, type, and location of birds in Andrews Forest since 2009. Early each morning, starting in May and continuing until late June, teams of trained scientists hike along transects that go through different forest types. Transects are parallel lines along which data are collected. At specific points along the transect, the team would stop and listen for bird songs and calls for 10 minutes. There are 184 survey locations, and they are visited multiple times each year.

At each sampling point, Matt, Sarah, and Hankyu carefully recorded a count for each bird species that they hear within 100 meters. They then averaged these data for each location along the transect to get an average number for the year. The scientists were also interested in the habitats along the transect, which includes the amount of understory plants and tall trees, two forest characteristics that are very important to birds. They measured the percent cover of understory vegetation, which shows how many bushes and small plants were around. They also measured the size of trees in the area, called basal area. 

Using these data, the research team is looking for patterns that will help them identify which habitat conditions are best for different bird species. With a better understanding of where bird species are successful, they can predict how changes in the forest could affect the number and types of birds living in Andrews Forest and nearby.  

Wilson’s Warblers and Hermit Warblers are two of the many songbirds that these scientists have recorded at Andrews Forests. Wilson’s Warblers are small songbirds that make their nests in the understory of the forests. Therefore, the team predicted that they would see more of Wilson’s Warblers in forest areas with more understory than in forest areas with less understory. Hermit Warblers, on the other hand, build nests in dense foliage of tall coniferous trees and search for spiders and insects in those coniferous trees. The team predicted that the Hermit Warblers would be observed more often in forest plots where there are larger trees.  

Featured scientists: Hankyu Kim, Matt Betts, and Sarah Frey from Oregon State University. Written with Eric Beck from Realms Middle School and Kari O’Connell from Oregon State University.

Flesch–Kincaid Reading Grade Level = 10.5

Additional teacher resource related to this Data Nugget:

Buried seeds, buried treasure

Marjorie (right) and David (left) digging up the seed bottle in 2021. This bottle was scheduled to be dug up in 2020, but the experiment was delayed one year due to COVID-19.

One of the world’s longest-running science experiments lies hidden in the soil beneath Michigan State University’s campus. Over 100 years ago, a scientist named William J. Beal had a question: how long do seeds survive underground? To find out, he started an experiment. In 1879 he filled 20 bottles with sand and seeds from local plants. William buried these bottles and created a map to document their location, hoping that future scientists would continue to dig them up to test whether the seeds would still grow long after his death.

These bottles and the map have been passed down from generation to generation, with each new scientist responsible for training their successor. To protect the seeds, only a select few scientists are let in on the secret. Today a team of four plant biologists hold the map, and they were the ones to dig up the most recent bottle in 2021. 

Early one Thursday morning, before the sun had risen, the team set out on their mission. Marjorie Weber, the first woman to be in charge of the study and currently the youngest team member, was the scientist who found the bottle and pulled it from the ground. This is a big deal, as back when William began the experiment women weren’t even allowed to be scientists!

Seeds of Verbascum blattaria germinating in 2021. This is the only species that germinated from the most recent collection.

Originally, the Beal Seed Experiment was designed to test seed viability, or how long seeds of different species stay alive in the soil and still germinate. Seeds don’t germinate as soon as they fall off their mother plant. They become part of a seed bank below the soil, waiting for the right conditions to tell them to sprout. William was working with local farmers in Michigan, and he was interested in helping them better understand how long weeds will continue to pop up in their fields after they start to plant crops. This is reflected in the fact that many of the species included in the experiment are weeds in agricultural fields. 

Despite all the changes that have taken place in the world since the seeds were buried 142 years ago, the main question remains the same: how long can seeds stay alive in the soil? In addition to helping farmers, Marjorie and the other scientists now have additional reasons for wanting to understand seed viability. Restoration of natural plant communities, conservation of endangered species, and removal of invasive plants from fragile ecosystems can all benefit from a knowledge of the seedbank. 

With this long-term study design, scientists can compare how many seeds sprout and which species are able to germinate through time. Originally, William dug up a new bottle every five years. Once scientists realized how long the seeds last, they made the interval between excavations longer; now they wait 20 years before digging up the next bottle. The experiment is set to go at least another 80 years. Imagine, future bottles will be dug up by scientists who are not even born yet!

Once a bottle is found and unearthed, it is taken back to the lab to see which species will germinate. Filled with sand and over a thousand seeds, each bottle contains the same mix of 50 seeds of 21 different species of plants. The contents are spread out on a tray filled with soil and are put into growth chambers. Scientists keep an eye on the trays to watch and see what germinates.

Featured scientist: Marjorie Weber from Michigan State University. 

Other scientists: Frank Telewski, David Lowry, Lars Brudvig, and Margaret Fleming.

Written by: Elizabeth Schultheis and Melissa Kjelvik.

Flesch–Kincaid Reading Grade Level = 9.7

Additional teacher resource related to this Data Nugget:

This experiment received a lot of press coverage. Have students check out these new stories and videos to learn more about the scientists and experiment:

YouTube video summarizing the search and the experiment:

Love that dirty water

Drew and students measuring river flow rate.

The activities are as follows:

Forests, wetlands, and other green spaces are natural filters for water; water is cleaned as it is used by plants and travels through soils. As green spaces are lost to make room for homes and businesses, ecosystems are less able to provide this service. Without natural filtration from green spaces, humans must build expensive water treatment systems or risk drinking contaminated water.

Impervious surfaces, like roads, buildings, and parking lots, do not allow water to pass through. When it rains or snows on an impervious surface, water cannot soak into soil or be used by plants. Instead, it quickly flows into nearby streams and rivers. If too much water runs off too quickly, it overwhelms local sewer systems, getting into rivers before it can be filtered. This dirty water may carry human waste and toxic materials. 

Impervious surfaces have become a major problem for both the health of river ecosystems, and the health of people who depend on them as a clean source of drinking water. How land is used in a watershed, or the network of land and rivers that flow to a single point as they empty out into the ocean, is an issue of great concern.

Jonathan is a scientist studying land use. He became interested in science after traveling around the country and working as a wilderness ranger and wildland firefighter. At the Harvard Forest, members of his lab study how land use decisions affect the environment. They used computer simulations to create maps of what New England’s landscape could look like under different possible futures. Their web-tool is called the New England Landscapes Futures Explorer. Johnathan’s lab works with Drew, a civil and environmental engineer who loves biking and hiking. Drew and his lab at Smith College are interested in the relationship between land use and water. Together, Jonathan and Drew’s labs teamed up to study how future increases in impervious surfaces from new development could affect water quality in New England. 

A team of scientists decided to use the web-tool to study the Merrimack River. The Merrimack is an important river for New England, and serves as a water source for more than 500,000 people in the region. It begins in New Hampshire, and flows through 117 miles of forests, farmland, and cities before emptying into the Atlantic Ocean.

To study the Merrimack, the scientists used their web-tool and data from two nearby similar watersheds to make predictions for the Merrimack. Combining research like this gives scientists, government organizations, and the public valuable information that can be used to help make decisions about how land should be used in the future.

Jonathan’s lab used their future land use predictions to estimate the percentage of impervious surface area in the Merrimack River watershed for three future scenarios in the year 2060. 

  1. Recent Trends: This scenario takes the historical rates and patterns of land use change from 1990-2010 and projects them through 2060.  This scenario imagines a future where we maintain current land use practices.
  2. Low Development: This scenario explores a future where the people of New England shift toward a lifestyle focused on “living local” and valuing reliance on local resources. This increases the urgency to protect local landscapes, including conservation of green spaces.  Rates of development are slightly lower than the Recent Trends scenario.
  3. High Development: This scenario explores a future with a rapid increase in human population in New England, because climate change has made life in many other places more difficult.  Rates of development are much higher than the Recent Trends scenario.

Drew’s team collected data from two watersheds adjacent to the Merrimack river (see map) and calculated the annual maximum daily flow, or the highest level that the river in each watershed would be expected to reach each day. Higher flows likely mean more human waste and toxic materials are getting into the river. These watersheds are similar to the Merrimack in some ways, but different in others. It is up to you to justify which watershed you think is most similar, and use the annual maximum daily flow data from that watershed to make your prediction for the Merrimack.

Featured scientists: Jonathan Thompson from Harvard University and Drew Guswa from Smith College. Written by Tara Goodhue and Joshua Plisinski. Supporting content by Amanda Suzzi.

Flesch–Kincaid Reading Grade Level = 11.3

Additional teacher resource related to this Data Nugget:

Blinking out?

A researcher collects data from a yellow sticky card at the MSU KBS LTER site. Photo Credit: K. Stepnitz, Michigan State University.

The activities are as follows:

The longest surveys of fireflies known to science was actually started by accident!

At the Kellogg Biological Station Long-Term Ecological Research Site, scientists work together to answer questions that can only be studied with long-term data. Their focus is to collect data in the same way over many consecutive years to look for patterns through time. One of these long-term studies, looking at lady beetle populations, was developed to keep watch on these important species. To count lady beetles, scientists placed yellow sticky card traps out in the same plots year after year. These data are used to figure out if lady beetle numbers are changing over time.

Because sticky traps catch everything small that flies by, other insect species get stuck as well. One day, a research technician noticed this and decided to add a few new columns to the data sheet. That way they could start recording data on the other insect species found on the sticky traps. Each year the technician kept adding to the record and over time, more and more data were collected. One of those new columns happened to record the number of fireflies caught. Though the exact reason for this data collection is lost to history, scientists quickly realized the value of this dataset! 

Several years later, Julia became the lab technician. She took over the responsibility of the sticky trap count, adding to the dataset. Christie joined this same lab as a scientist and stumbled upon the data on fireflies that Julia and the previous technician had collected. She wanted to take advantage of the long-term data and analyze whether firefly populations had been increasing or decreasing. 

Many people have fond memories of watching fireflies blink across open fields and collecting them in jars as children. This is one of the reasons why fireflies are a beloved insect species. Julia grew up in southwest Michigan and fondly recalls spending summers watching them blink over yards and open fields, catching them in jars to watch them for a little while. Christie did the same in her parent’s yard in rural Ontario! That fondness never really went away and both enjoy watching the fireflies around Northeast Ohio where they currently live. Fireflies are also an important part of the ecosystems where they live. Larvae spend most of their time in the soil and are predators of insects and other small animals, such as snails. 

All the insects collected on a yellow sticky card trap over the course of one week. Photo credit: Elizabeth D’Auria, Michigan State University.

Many scientists and citizens alike have noticed that they aren’t seeing as many fireflies as they used to. Habitat loss and light pollution could be causing problems for fireflies. This is where the importance of long-term data really comes into play. Long-term data are critical to identifying and understanding natural population cycles over long periods of time that we wouldn’t be able to see with just a few years of data. It also gives scientists opportunities to answer unanticipated research questions. In this situation, even though the data were collected without a specific purpose in mind, having the dataset available offered new opportunities! Christie and Julia were able to look at the long-term changes in southwest Michigan firefly populations, something they would not have been able to do before the research technician added those extra columns. In order to start answering this question, they compiled all of the years of firefly data and began to compare the average counts from year to year. Although data were collected in multiple different habitat types, they focused on data from open fields because fireflies use these areas to find mates.

Featured scientists: Christie Bahlai and Julia Perrone from Kent State University. Data from the Kellogg Biological Station LTER.

Flesch–Kincaid Reading Grade Level = 10.7

Additional teacher resources related to this Data Nugget include:

How milkweed plants defend against monarch butterflies

Anurag looking at a monarch caterpillar on a milkweed plant.

The activities are as follows:

For millions of years, monarch butterflies have been antagonizing milkweed plants. Although adult monarchs drink nectar from flowers, their caterpillars only eat milkweed leaves, which harms the plants. This is an ecological interaction called herbivory. The only food for monarchs is milkweed leaves, meaning they have evolved to be highly specialized, picky eaters. But their food is not a passive victim. Like most other plants, milkweeds fight back with defenses against herbivory.

Monarch butterflies lay their eggs on the underside of milkweed leaves. After eggs hatch, caterpillars start to feed and quickly meet the plant’s first defense. Milkweed leaves are covered in thousands of tiny hairs, called trichomes, that the caterpillar needs to shave off before they can take a bite. The next challenge happens when the caterpillar takes a bite of the leaf. They get a mouthful of latex, which is sticky like Elmer’s glue. The caterpillars have to be very careful in how they feed. They cut the veins in the leaf to drain out the latex before continuing to feed on the leaf. Even after monarch caterpillars make it past the trichomes and latex, there’s another defense they need to overcome. Milkweed leaves have chemical toxins called cardiac glycosides, which are poisonous to most animals. As they feed, monarchs eat some of this poison.

Anurag is a scientist who has long been fascinated by plants and their defenses. He thinks this comes from the fact that his mother was such an avid gardener. She would grow food, such as peppers, squashes, and tomatoes. He looks back and has memories that are associated with garden plants and their defenses. For example, he remembers eating a bitter cucumber as a kid and spitting it out. He also can still recall the bitter aroma on his hand after brushing against the sticky tomato leaves. And plants that are tough and stringy, like kale, are not as tasty to eat. These traits are examples of plant defenses in action, making them harder or less enjoyable to eat, reducing herbivory.

Anurag collecting data on milkweed plants.

Anurag first started studying milkweeds 20 years ago, based on a recommendation from a friend. His friend told him of the bitter, sticky, and furry leaves that were treasured by the monarch butterfly caterpillars. This led him to study the paradox of coevolution. The milkweed and monarch have such a tight relationship that over time, milkweeds have evolved multiple ways to defend themselves against their herbivores. In response, monarchs have evolved to overcome those defenses because they need to eat the milkweed. This arms race may continue to shift back and forth over the course of evolutionary time.

This back-and-forth battle between caterpillar and plant intrigued Anurag. He wanted to know whether milkweed’s defensive traits are still effective against monarchs, or have monarchs evolved in ways that make them unaffected by the defenses? Because each defense trait might be at a different phase in the coevolution process, perhaps some would be effective defenses to herbivory, but others would not be effective. He predicted that monarchs would be harmed by all three milkweed defense traits (trichomes, latex, and cardiac glycosides), but that some would cause more harm than others.

To test his ideas, Anurag and his collaborators grew monarch caterpillars on 24 different North American milkweed species. They put a single newly hatched caterpillar on each plant and had five replicate plants per milkweed species. They recorded each caterpillar’s growth over the course of 5 days to see how healthy it was. They also measured the amount of trichomes, latex, and cardiac glycosides in each plant to determine their level of defense. Once they had their data, they looked for a relationship between caterpillar growth and plant defense traits to determine which made the best plant defenses. The better the defense, the less caterpillars would grow.

Featured scientist: Anurag Agrawal (He/Him/His) from Cornell University

Flesch–Kincaid Reading Grade Level = 8.5

Additional teacher resources related to this Data Nugget include:

  • Anurag has other examples, data, and related stories in his book: Monarchs and Milkweed, which is written for budding scientists and interested naturalists: www.amazon.com/dp/0691166358.
  • Students can learn more about Anurag, his research, and his lab at his website: www.herbivory.com which includes blog posts about monarch conservation, the community of insects on milkweed plants, videos of talks and presentations, and other things related to his research and teaching at Cornell University.
  • A scientific article based on this research: Agrawal, A. A., Fishbein, M., Jetter, R., Salminen, J. P., Goldstein, J. B., Freitag, A. E., & Sparks, J. P. (2009). Phylogenetic ecology of leaf surface traits in the milkweeds (Asclepias spp.): chemistry, ecophysiology, and insect behavior. New Phytologist183(3), 848-867.
  • Learn more about Anurag and his research in this YouTube video!

Breathing in, Part 2

The activities are as follows:

Susan (left) and Kristina (right), the scientist team leading the ForC project.

In Part 1, you learned how trees “breathe in” and accumulate carbon dioxide within their tissues during photosynthesis. You also examined data from ForC, the Global Forest Carbon Database. Using this dataset, you studied how “breathing in” differed in regrowing forests around the world. Now it’s time to go a step further and see how Susan and Kristina used the ForC database to take action!

Like many other scientists, Susan and Kristina are concerned about global warming. Global warming is the well-documented rise of the temperature of Earth’s surface, oceans, and atmosphere. As of 2020, global temperatures are now warmer by about 1 °C (1.8 °F) than they were before people started burning a lot of fossil fuels in the late 1700’s. While this may seem like a small increase, it has already caused major changes on Earth.

To ease global warming, humanity needs to not only reduce their greenhouse gas emissions, but also to capture the excess greenhouse gases in the atmosphere. This is a huge motivating factor for Kristina and Susan’s investigation into regrowing forests in Part 1 and the main reason they created the ForC database.

Thankfully, Susan and Kristina are not alone. People from all around the world share their concern. That’s one of the reasons the Intergovernmental Panel on Climate Change (IPCC) was established in 1988 by the United Nations. The IPCC is dedicated to providing the world with reliable scientific information on the risks, impacts, and response options of climate change. So, it makes sense that the IPCC is also interested in data on carbon accumulation due to forest regrowth.

Susan and Kristina wanted to make sure that the IPCC has the most precise data available in order to better inform policy decisions. They were confident their dataset would improve upon what the IPCC had available when they calculated their estimates. They hoped their work would be incorporated into the IPCC’s next update.

Kristina and Susan thought that the forest carbon accumulation values calculated by ForC would be different than those provided by the IPCC. They anticipated their values would be more precise because of the additional variables they had compiled. In the end, they and their colleagues combined field measurements with 66 environmental variables that could affect carbon accumulation in young regrowing forests. This fine-tuned model was used to create a global map that predicts the potential aboveground carbon accumulation for the first 30 years of forest regrowth. They were able to look at the varying forest types at a finer scale, zooming in to a resolution of one kilometer!

Map showing the distribution of boreal, tropical moist broadleaf, and tropical/subtropical dry broadleaf forests across the globe. Illustrated by Habib Aina.

However, before Susan and Kristina would present their map model to IPCC, they needed to first compare their values with the IPCC’s current model. They chose to focus on three forest types: boreal, tropical dry broadleaf, tropical moist dryleaf. They looked at each forest type on three different continents and compared the estimated values from the IPCC model to the ForC model. If the ForC model is more precise, they expected to see very different values for different locations of the same forest type. If ForC did not increase precision, the values for each continent would be similar to the IPCC values in each forest type.

Featured scientists: Kristina J. Anderson-Teixeira, Smithsonian Conservation Biology Institute & Susan C. Cook-Patton, The Nature Conservancy. Written by Ryan Helcoski.

Flesch–Kincaid Reading Grade Level = 10.0

Additional classroom resources for this Data Nugget:

  • ForC Education: There are lesson plans that can be used to examine the ForC database. This is a private link with additional lesson plans for anyone interested in further exploring the database and asking original questions.
  • If you would like to explore the ForC database in your classroom, students can view the shiny app. Anyone that feels even more ambitious can see the raw data.

Purring crickets: The evolution of a new cricket song

Robin’s team recording purring and typical cricket songs in the field. They analyzed the recordings and discovered that purring was a new song.

The activities are as follows:

Animals use many types of mating signals to attract mates. Some of these signals are probably familiar to you, like the bright colors of birds’ feathers, complex courtship dances of fish, and loud calls of frogs. In crickets, males rub their wings together to produce chirping mating songs that attract females. However, in one species of cricket, these mating songs have led to an issue – while they attract females towards the male, they also attract parasitoid flies. These flies kill the crickets by eating them from the inside out! Parasitoids are animals that lay their eggs in another organism’s body. The eggs develop and usually kill the host.

About twenty years ago, scientists discovered male Pacific field crickets in several spots in Hawaii had stopped making songs. By looking at their wings and DNA, scientists were able to find the exact genetic mutation causing their silence. This change in DNA made some crickets to grow with flat wings that made no sound. Males with this mutation are able to escape detection by the parasitoid flies. However, being silent also posed a struggle because flat winged males could no longer use songs to attract female mates. Scientists waited and watched – would a new way to attract females evolve over time, one that is audible to females, but not to the flies?

Robin is a scientist who has been studying the mating signals in these crickets for many years. One summer, Robin was working in Hawaii and brought a Tupperware container full of crickets into her room. Suddenly, she heard what sounded like a purring cat, but there was no cat in sight. She soon realized the sound was coming from her container of crickets. This song was unlike anything ever observed before in crickets. 

Robin thought that this purring song might be the beginning of the evolution of a novel signal that could be detected by female crickets. If purring is a mating signal, female crickets should have a positive response to purring songs. One way to test this idea is to observe whether females move towards a purring song.

She set out to test her hypothesis with phonotaxis experiments in the lab. During phonotaxis experiments, scientists observe how an organism moves with respect to different sounds. In their first experiment, Robin and her colleagues placed a female at the center of an arena and played a purring song through 1 of 4 speakers. The other 3 speakers were silent. To document the female’s willingness to mate, Robin recorded if the female moved toward the purring and which speakers they contacted. If the purring song was not a mating signal, it should not be attractive to the females and she expected them to contact the speakers at random. This would mean that the purring speaker should be contacted 25% of the time (since only 1 of the 4 speakers broadcast purring). If the purring song was a mating signal, she expected female crickets to contact purring speakers more than 25% of the time.

In a second experiment, Robin investigated whether female crickets prefer purring songs as much as typical mating songs. Using the same set-up, she played either a typical or purring song through 1 of 4 speakers. If females moved toward the speaker playing a  song before the silent ones, she recorded the search time. Search time was calculated as the time it took the female to contact the broadcasting speaker minus the time at which the crickets started looking for the speaker. To see whether the purring song was evolving as a mating signal, she compared the time it took crickets to find speakers broadcasting the purring song compared to the typcal mating song. She predicted that if females still preferred the typical song more than the new song, that they would have longer search times for purring versus typical songs.

Left, a purring male from Moloka’i. Right, a purring male singing to attract mates. Photo credit: E. Dale Broder.

Featured scientist: Robin Tinghitella from The University of Denver.Written by: Gabrielle Welsh

Flesch–Kincaid Reading Grade Level = 9.3

Additional teacher resources related to this Data Nugget include:

Stop that oxidation! What fruit flies teach us about human health

Laboratory fruit flies in their natural habitat: a plastic vial. Photo credit: Conni Wetzker

The activities are as follows:

Have you ever eaten an apple and noticed that, after a while, the core turns brown? That’s because of oxidation – a chemical reaction between the oxygen in the air and the inside of the apple. The same thing is happening inside our own bodies all the time.

Each of our cells is home to mitochondria, tiny factories whose job is to turn the food we eat into the energy we need to live. But mitochondria also make molecules called reactive oxygen species, or ROS. As the name suggests, these molecules contain oxygen and tend to react with the things around them. Like the oxygen in the air reacting with the apple core and turning it brown, ROS react with different parts of the cell, causing oxidative damage. Everything in the cell, including our DNA, can be damaged by ROS molecules. Too much damage contributes to diseases including cancer, heart disease, diabetes, and Parkinson’s.

Bodies can prevent oxidative damage in two ways. First, they can use antioxidants. Antioxidants work by reacting with ROS to stop them from harming cells. Some antioxidants come from the food we eat, while others are made inside the body. If a body doesn’t have enough antioxidants, it can get sick. One example is a genetic mutation called DJ-1. It stops the body from producing antioxidant molecules. Many people with Parkinson’s disease, a neurological illness, have this DJ-1 mutation.

Some living things have evolved a second way to stop oxidative damage: their mitochondria actually make fewer ROS! These species have a special protein called alternative oxidase, or AOX. It works by shortening the pathway that mitochondria use to turn food into energy. A shorter pathway means fewer ROS are made. Scientists have been able to take the AOX gene and move it into other species.

Biz, a scientist studying oxidative damage, wanted to study the effects of the DJ-1 mutation and the AOX gene. To do their research, Biz uses fruit flies. Fruit flies are useful because they are easy to work with and scientists can control the types of mutations and genes they have in the lab. Some of these mutations are the same as those found in humans, so scientists can use them to study human disease. In one study, scientists were able to take the AOX gene and put it into the fruit fly. Fruit flies can also have the DJ-1 mutation that stops antioxidants from being made. Biz used these genetic tools to work with flies that have less oxidative damage (AOX mutants), more oxidative damage (DJ-1 mutants), or normal levels (controls).

Biz was interested in how AOX and DJ-1 affect reproductive cells – sperm and eggs. Oxidative damage is even more dangerous for reproductive cells than for other cells. Whereas most cells can just self-destruct or stop replicating when they build up too much damage, sperm and eggs have to stay healthy up until the moment of fertilization. This wait can last a long time. In many species, females store the male’s sperm inside their own bodies for days, months, or even years after mating! In addition to making their own ROS and antioxidants, sperm and egg cells stored inside the female can be damaged or protected by ROS and antioxidants made by the female’s reproductive tract. Either way, damage to reproductive cells is very important because it can be passed on to future generations or can cause the offspring to die.

Biz wanted to test whether the level of oxidative damage in eggs and stored sperm would influence how many offspring a female had. If cells with oxidative damage do not produce healthy offspring, then fruit flies with less damage should have more offspring.  Biz also expected that fruit flies with more damage should have fewer offspring. To test these ideas, Biz mated normal male fruit flies to three groups of females: females with the AOX gene, females with the DJ-1 mutation, and normal (“control”) females. Aside from having the AOX or DJ-1 gene, the females in all treatments were genetically the same. The males used in the experiment were also genetically identical. After the males and females mated, Biz counted the number of surviving offspring from each group.

Featured scientist: Biz Turnell from Cornell University and Technische Universität Dresden

Flesch–Kincaid Reading Grade Level = 9.0

Getting to the roots of serpentine soils

Alexandria in the field observing the plants and soil.

When an organism grows in different environments, some traits change to fit the conditions. For example, if a houseplant is grown in the shade, it might grow to stretch out long and thin to reach as much light as possible. If that same plant were grown in the sun, it would grow thicker stems and more leaves that are not spread as far apart. This response to the environment helps plants grow in the different conditions they find themselves in.

Flexibility is especially important when a plant is living in a harsh environment. One such environment is serpentine soils. These soils are created from the weathering of the California state rock, Serpentinite. Serpentine soils have high amounts of toxic heavy metals, do not hold water well, and have low nutrient levels. Low levels of water and nutrients found in serpentine soils limit plant growth. In addition, a high level of heavy metals in serpentine soils can actually poison the plant with magnesium!

Combined, these qualities make it so that most types of plants are not able to grow on serpentine soils. However, some plant species have traits that help them tolerate these harsh conditions. Species that are able to live in serpentine soils, but can also grow in other environments, are called serpentine-indifferent.

Alexandria has been working with serpentine soils since 2011 when she was first introduced to them during an undergraduate research experience with her ecology professor. Alexandria was especially intrigued by this challenging environment and how organisms are able to thrive in it, even with the harsh characteristics.

Dot-seed plantain plants in the growth chamber.

To learn more, she started to read articles about previous research on plants that can only grow in serpentine soils. Alexandria learned that these plant species are generally smaller than closely related species. This was interesting, but she still had questions. She noticed the other experiments had compared plant size in different species, not within one species. She thought the next step would be to look at how plants that are the exact same species would respond to serpentine and non-serpentine soil environments. To explore this question, she would need to use serpentine-indifferent plant species because they can grow in serpentine soils and other soils.

Just as a houseplant grows differently in the sun or shade, plants grown in serpentine and non-serpentine soils might change to survive in their environment. Alexandria thought one of these changes could be happening in the roots. She decided to focus on plant roots because of their importance for plant survival and health. Roots are some of the first organs that many plants produce and anchor them to the ground. Throughout a plant’s life, the roots are essential because they bring nutrients to above-ground organs such as leaves. Because serpentine soils have fewer plant nutrients and are drier than non-serpentine soils, Alexandria thought that plants growing in serpentine soils may not invest as much into large root systems. She predicted plants growing in serpentine soils will have smaller roots than plants growing in non-serpentine soils.

To test her ideas, she studied the effects of soil type on a serpentine-indifferent plant species called Dot-seed plantain. She purchased seeds for her experiment from a local commercial seed company. About 5 seeds were planted in serpentine or non-serpentine soils in a growth chamber where growing conditions were kept the same. After the seedlings emerged, the plants were thinned so that there was one plant per pot. The only difference in the environment was the soil type. This allowed Alexandria to attribute any differences in root length to serpentine soils. At the end of her experiment, she pulled the plants out of the soil and measured the root lengths of plants in both treatments.

Featured scientist: Alexandria Igwe (she/her) from University of Miami

Flesch–Kincaid Reading Grade Level = 8.7

Additional resources related to this Data Nugget:

The topics described in this Data Nugget are similar to the published research in the following article:

  • Igwe, A.N. and Vannette, R.L. 2019. Bacterial communities differ between plant species and soil type, and differentially influence seedling establishment on serpentine soils. Plant Soil: 441: 423-437

There is a short video of Alexandria (Allie) sharing her research on serpentine soils.

There have been several news stories and blog posts about this research: